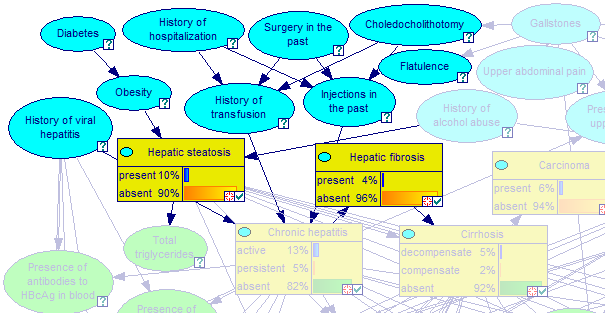
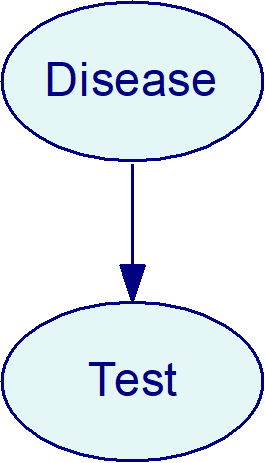
The Graph View is the primary model view in GeNIe. It shows a directed graph in which each node represents a variable and each arc represents an influence between two nodes. It is an intuitive environment for creating and editing networks, useful in gaining insight into models by making the structure of their graphs explicit. A slightly modified version of the Graph View is the Cost Graph View, described in section Cost of observation.
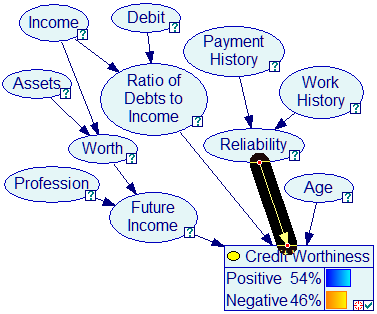
An example of the Graph View is shown below:
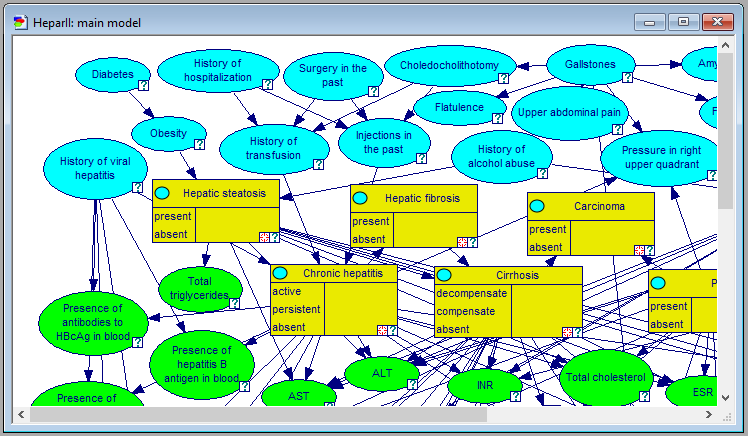
Graph View can be enhanced dramatically by structuring the model hierarchically into submodels. Please see the section on GeNIe submodels to learn more about it.
The Layout Menu and buttons on the Format Toolbar can be used to change the aesthetic properties of the Graph View.
Commands for displaying or hiding the grid and aligning the elements in the graph can be found in the Layout Menu.
The Format Toolbar has buttons for changing the font, color and size of the labels of the nodes, and buttons for performing the aligning operations on text and on the elements of the graph.
Please see Layout Menu and Format Toolbar for more information.
Opening a Graph View window
The graph view window is always open by default whenever a new model is opened or created. It is a large sheet with variables placed at user-designated locations. You can select the Open option from the File Menu to open a saved network file. You can create a new network by selecting the New option from the File Menu.
Closing a Graph View window
There are three ways in which you can close a Graph View window:
•By clicking on the Close (![]() )button at the top right of the Graph View window.
)button at the top right of the Graph View window.
•By selecting the Close option in the File Menu.
•By selecting the Close Network option from the Network Pop-up menu in the Tree View.
If you close all the windows of an open network then it will result in closing the file, and if any changes have been made on the network, GeNIe will give you a warning with the dialog box shown below.
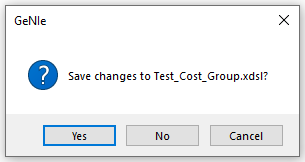
You can save the changes by clicking on the Yes button. Click on Cancel to continue working on the network.
Working with networks in the Graph View:
Each network is opened in a separate graph view sheet in the workspace. Double clicking on a clear area of the graph view sheet will open the Network Property Sheet. Right clicking on any clear area of the graph view sheet will display the Network Pop-up menu, which can be used to modify various properties of the network.
Working with nodes in the Graph View:
You can draw new nodes in the Graph View by selecting the appropriate tool from the Tools Menu or clicking on the appropriate button on the Standard Toolbar.
Double clicking on any node will open its Node Properties Sheet. Right clicking on the node will display the Node Pop-up menu. It can be used to modify the properties of the node.
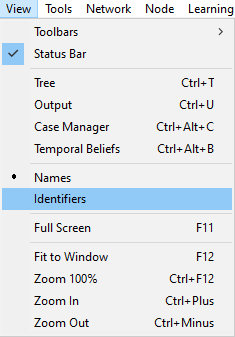
By default, GeNIe displays the node names within the node icons in the Graph View. If you want GeNIe to display node identifiers instead, select Identifiers in the View Menu. to switch the display to identifiers.
Working with submodels in the Graph View:
Double clicking on any submodel in the Graph View will open a Graph View for that submodel. You can go back to the main network by either minimizing or closing the submodel using the buttons on the top right of the submodel window. Right clicking on the submodel will display the Submodel Pop-up Menu. It can be used to modify the properties of the submodel.
Adding model elements
You can draw the following model elements in the Graph View:
•Nodes
•Submodels
•Arcs
•Text Boxes
To add any model element to the Graph View, you have to first select a tool, either from the Tools Menu below
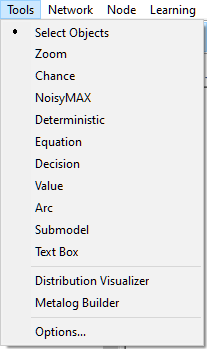
or a button from the Standard Toolbar below
![]()
The next step is to click on any clear area of the Graph View. For all elements except the arc, GeNIe will draw the icon of the element in the Graph View.
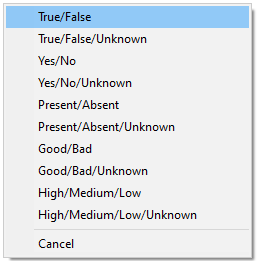
If you press and hold the SHIFT key on the keyboard and click the left mouse button, GeNIe will propose a small set of standard definitions. For discrete nodes, the following menu with Quick states list for the nodes will pop up:
For continuous (Equation) nodes, the following menu will pop up:
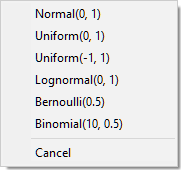
To create a node with a standard definition listed in these menus, please select the definition that is most relevant to your node and click the left mouse button. In both cases, the definition can be subsequently modified to the desired values.
To add an arc between two nodes,
1. Select the arc tool and click on the parent node.
2. Drag the mouse cursor to the child node and release the mouse button.
GeNIe will draw an arc from the parent node to the child node.
To learn more about creating nodes and arcs, See Building a Bayesian network and Building an influence diagram.
Selecting, re-sizing, and moving model elements
You need to select an element to perform an operation that is specific to it.
You can select a single element by clicking on it. The element will show tracker points (small squares around the perimeter of the selected element) that can be used to re-size it. You can re-size the element in any direction by dragging one of these points. Arcs cannot be re-sized, as GeNIe automatically draws them for you between pairs of nodes connected by arcs.
Sometimes, it may be convenient to select several nodes at a time. There are four ways of selecting nodes in groups in the Graph View:
•Rectangular selection
You can select a group of nodes by clicking on an empty area of the Graph View and dragging a selection rectangle in any direction that you wish. Any node completely within the rectangle will be selected. When you draw a rectangular selection with SHIFT key pressed, the selection will be added to the existing selection. When you draw a rectangular selection with both CTRL and SHIFT pressed, the current selection status will be inverted, i.e., model elements selected will become unselected and model elements unselected will become selected.
•Extended selection
Once you have an element, such as a node or a group of nodes or text boxes, selected, you can add or remove individual elements from the selection by holding the SHIFT key while clicking on them. This selection process acts as a toggle, i.e., nodes that are currently selected will be de-selected.
•Group selection
You can select a specific group of nodes or all nodes in the current window by choosing Select All from the Edit Menu. The shortcut for this selection is CTRL+A.
•Select Nodes... dialog
Select Nodes... dialog allows for selecting nodes based on their names or IDs. We will discuss this powerful selection tool in section Selection of model elements.
•Select Evidence Nodes
This command selects all nodes that have observed evidence in them. If there are no evidence nodes in the network, this choice is dimmed.
•Select Disconnected Nodes
This command selects all nodes that are disconnected from the graph, i.e., have neither parents no children. Typically, such nodes are left disconnected by mistake, so selecting and subsequently highlighting them is a good way of finding them in the model, which may be otherwise challenging in sizable models. If there are no disconnected nodes in the network, this choice is dimmed.
•Select Parentless Nodes
This command selects all nodes that have no parents. This is a fast way of identifying those nodes that are exogenous to the model. This selection command works within the current sub-model window, so while a model will always have nodes without parents, there may be no such nodes in the current sub-model. If this happens, the command will be grayed-out.
•Select Childless Nodes
This command selects all nodes that have no children. This is a fast way of identifying possibly barren nodes. This selection command works within the current sub-model window, so while a model will always have nodes without children, there may be no such nodes in the current sub-model. If this happens, the command will be grayed-out.
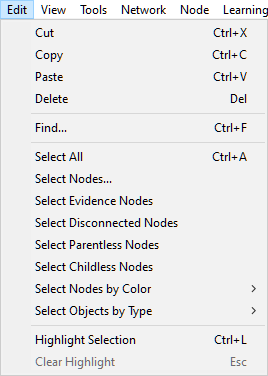
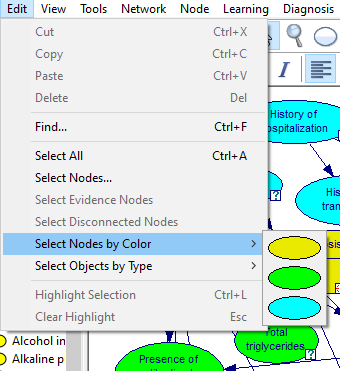
•Select Nodes by Color sub-menu
Nodes can be selected based on their colors. This can be done by selecting a color listed in the Select Nodes by Color sub-menu shown below. Colors will be listed in the sub-menu only if the model contains nodes in these colors.
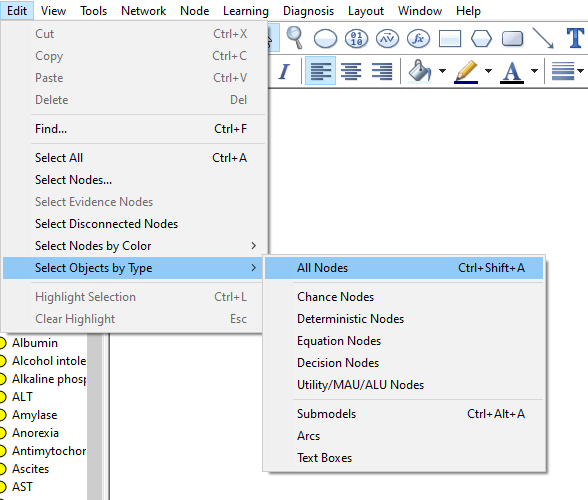
•Select Objects by Type sub-menu
You can select nodes of each type (Chance, Deterministic, Decision, and Utility nodes), submodels, arcs, and text boxes in the entire model by choosing the appropriate option from the Select Objects by Type sub-menu shown below.
You can move a node or a group of nodes to another location by dragging it. When you press the SHIFT key (you need to do it after clicking on the node or the selection, as SHIFT-Click has the meaning of adding an object to the selection), the moving is limited to horizontal and vertical directions.
A node or a set of nodes can be also moved between submodels. To move a node to a different submodel, drag and drop it into a submodel icon or into a submodel window.
Highlighting selected model elements
GeNIe allows for highlighting the selected model elements (nodes, arcs, submodels, etc.) through the command Highlight Selection in the Edit Menu (short-cut CTRL-L) or through the Highlight button (![]() ) on the main toolbar. The following screen shot shows a rectangular selection of model elements in Graph View,
) on the main toolbar. The following screen shot shows a rectangular selection of model elements in Graph View,
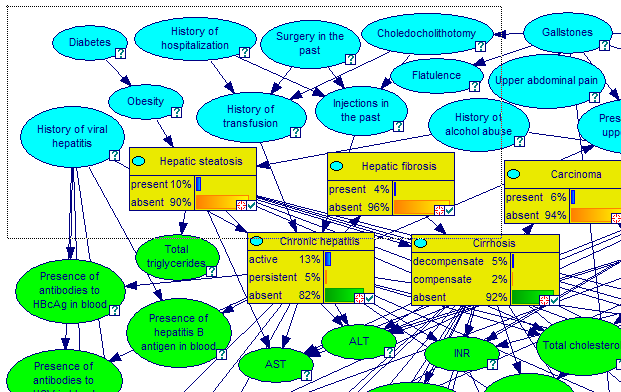
This results in selecting a group of nodes and arcs
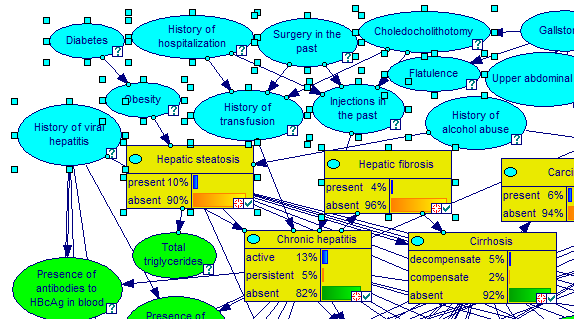
When these elements are highlighted, the Graph View changes to the following
Pressing the ESC button or selecting Clear Highlight from the Edit Menu clears the selection.
Extending the workspace
GeNIe is somewhat restrictive in how far the Graph View space stretches in every direction and there is typically not too much space beyond the borders. If you want to move model elements in any direction, please bring them close to the border and this will force GeNIe to move the border.
Deleting model elements
To delete an element or a group of elements, select them and press the Delete key on the keyboard.
Deleting a node deletes all its incoming and outgoing arcs.
Deleting an arc has important implications for the nodes to which they point. They are no longer indexed by the nodes from which the arcs were coming. GeNIe will reduce the dimension of the conditional probability table and it makes a good faith attempt to preserve as much as possible, removing part of the table. You should always reexamine the conditional probability table to check whether the new table is what you intended it to be.
Copying, cutting, and pasting model elements
Model elements or group of elements can be copied or cut into the Windows Clipboard, and subsequently pasted into the same or a different Graph View window or into another application. To invoke any of these commands, please select them from the Edit Menu or from the Standard Toolbar (shown above, buttons ![]() ,
, ![]() , and
, and ![]() , respectively). Nodes pasted into the same window will preserve their incoming arcs but will lose their outgoing arcs. The reason for this is simple - the nodes need their parents in order to preserve their definition, which is typically conditional on its parents. On the other hand, preserving the outgoing arcs would mean that their child nodes would have double set of parents, i.e., the original nodes and their copies.
, respectively). Nodes pasted into the same window will preserve their incoming arcs but will lose their outgoing arcs. The reason for this is simple - the nodes need their parents in order to preserve their definition, which is typically conditional on its parents. On the other hand, preserving the outgoing arcs would mean that their child nodes would have double set of parents, i.e., the original nodes and their copies.
Clipboard supports multiple formats. GeNIe is capable of storing data on the clipboard in four different formats:
1. Native GeNIe format for cut, copy, and paste operations between models
2. Standard unformatted text and unformatted Unicode text, for example names of selected nodes and comments
3. Standard bitmap and device independent bitmap, which are used for selected objects that have a graphical component
4. Picture (metafile or enhanced metafile), used only for plots and objects selected from the Graph View.
Each time you invoke Copy or Cut in the Graph View, data in all four formats are sent to the Clipboard. Each external application has its default paste format. Plain Paste command does thus different things in different programs - it pastes data as text into Word by default but may paste a bitmap image in Paint. Should you want to change this default format, all you need to do is select Paste special from that application's Edit Menu (e.g., in Word or PowerPoint). This should bring the dialog box with all format names.
To copy a complete model as a bitmap picture, first select all elements in the model using the CTRL+A shortcut. Then use the CTRL+C shortcut to copy the model to the clipboard. Subsequently, open the program in which you want to paste the model image (e.g., Adobe Photoshop or MS Word) and use Paste special and then Bitmap or Picture in Word. If you use Photo Editor or any graphics editing program, Paste will paste the model image by default.
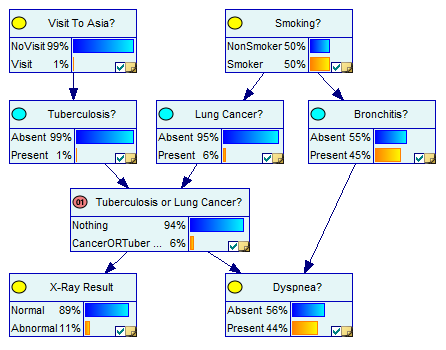
The Picture format contains the image content as vectors, which allows for better scaling and (in some programs) additional effects. Enlarging Picture objects leads to minimal loss of quality. Compare the following fragment of the tutorial network pasted as a Bitmap (left) and a Picture (right) objects:
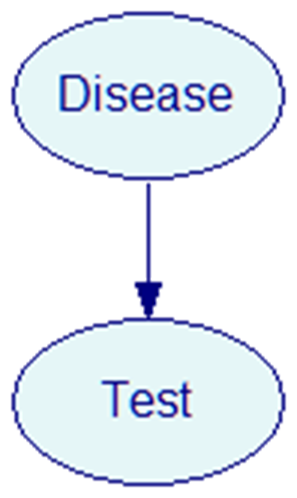
There is no visible difference between the two. However, when we enlarge the two images by 300%, we will notice that the Bitmap object yields a much worse quality image than the Picture object (right):
Furthermore, the Picture object can be processed further, for example enhanced by means of Picture Tools in Word:
Text-based search for model elements (Find command)
Find (![]() ) button from the toolbar or selecting Find from the Edit Menu (shortcut CTRL-F) invokes the following dialog, which allows for finding model elements, such as nodes, through text search
) button from the toolbar or selecting Find from the Edit Menu (shortcut CTRL-F) invokes the following dialog, which allows for finding model elements, such as nodes, through text search
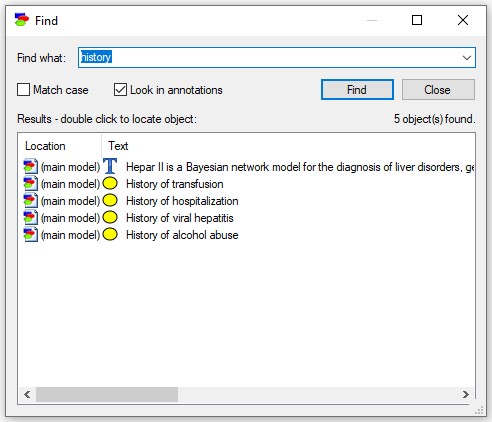
The Find dialog allows for finding the text string specified in the Find what box in the names and identifiers of all elements of the models and submodels. It will also search within annotations if the Look in annotations check box is checked. Match case flag allows for additional customization of the search. Pressing the Find button starts the search. If any matches are found, they are displayed in the dialog box and the Find button changes into the Locate button. Selecting one of the results and pressing the Locate button locates the selected node in the Graph View, centers it, and flashes three times. You can also locate a node by double clicking on one of the results.
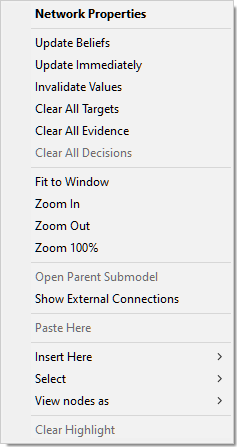
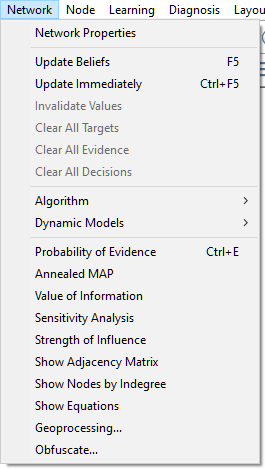
Network Pop-up menu for Graph View
The Network Popup Menu for the Graph View can be accessed by right clicking on any clear area of the Graph View. Some of the options might be disabled depending on the properties of the network selected.
Most of the commands found here can be also invoked from the Network Menu.
Network Properties (the default operation) opens the Network Properties sheet for the network.
Update Beliefs runs the selected algorithm on the model and brings the values of each of the variables of interest up to date. The Update Beliefs command can be also executed by pressing the Update (![]() ) tool from the Standard Toolbar. The algorithm to be applied can be selected from the Network Menu. For more information on various inference algorithms supported by GeNIe, see Inference algorithms section.
) tool from the Standard Toolbar. The algorithm to be applied can be selected from the Network Menu. For more information on various inference algorithms supported by GeNIe, see Inference algorithms section.
Update Immediately is a flag, which when set invokes Bayesian inference as soon as any change happens to the model. It is convenient to have it turned off as we build a model (to avoid computation when the model is incomplete and updating does not make much sense yet) and turned on when the model is ready.
Invalidate Values is the same as the Invalidate Values command in Network Menu - it removes all computation results from the network.
Clear All Targets/Evidence/Decisions are the same as the corresponding commands in the Network Menu.
Fit to Window makes the network as large or as small as it takes to fit entirely in the Graph View.
Zoom In zooms into the network. Every application of this command increases the zoom by 25%. The current zoom percentage is displayed on the top right of the Standard Toolbar. A similar effect can be obtained by using the zoom tool from the Standard Toolbar or the Tools Menu.
Zoom Out is the opposite of the Zoom In and it zooms out of the network. Every application of this command decreases the zoom by 25%. The current zoom percentage is displayed on the top right of the Standard Toolbar.
Zoom 100% brings the model displayed in the Graph View to its original size.
Open Parent Submodel is enabled only if the current network in the Graph View is a submodel of another network. The result of this command is opening the Graph View window displaying the parent submodel.
Show External Connections is a structure analysis tools described in the Structural Analysis section.
Paste Here pastes the contents of the clipboard onto the Graph View into the exact position of the mouse click that invoked the pop-up menu. This choice will be active only if the clipboard has data that have been entered using the Cut or Copy command within GeNIe. You cannot Cut or Copy items from other programs into GeNIe Graph View. You can Cut or Copy nodes between two running instances of GeNIe.
Insert Here submenu
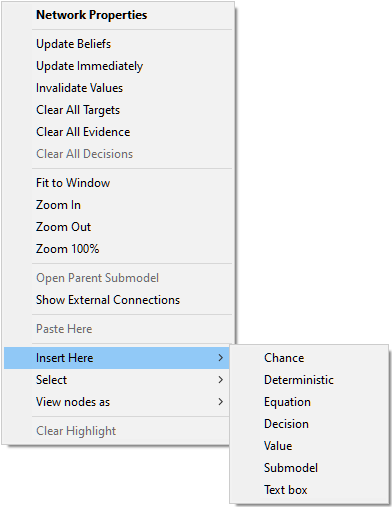
The Insert Here submenu contains a list of all elements that can be drawn in the Graph View. Select any of the items on the list to place that item at the current cursor position. See Components of GeNIe models section for more information on each item.
Select submenu
Selection of items enables certain operations to be performed on them without affecting other items that are not selected. Some options in GeNIe will not be enabled unless some item has been selected.
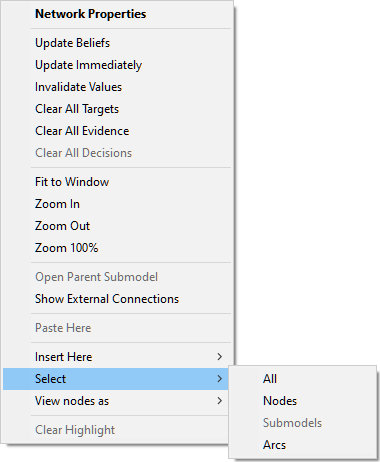
The Select submenu contains following options: All (select all items in the Graph View), Nodes (select all nodes in the Graph View), Submodels (select all submodels in the Graph View; dimmed if the current Graph View does not contain any submodels), and Arcs (select all arcs in the Graph View).
View nodes as submenu
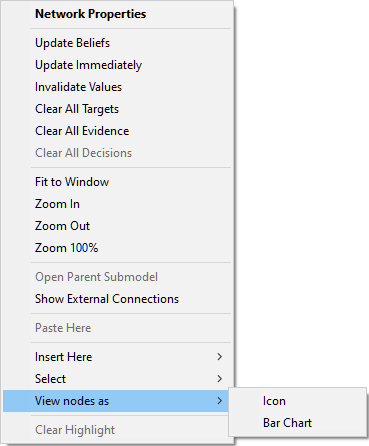
The View nodes as submenu is used to select how the nodes should be displayed in the Graph View. It is similar to the View As submenu in the Node Menu but because right-clicking on the background of the model deselects everything, it always applies to all nodes rather than to the possibly previously selected nodes.
Clear Highlight clears highlighting of model elements (dimmed if no model elements are currently highlighted).
Adjacency matrix
For any directed graph of a Bayesian network, it is possible to view its adjacency matrix, which is a compact way of viewing the graph's dependences. To invoke the adjacency matrix, please select Show Adjacency Matrix from the Network Menu.
Adjacency matrix is a square matrix offering an alternative representation of a graph. The elements of the matrix indicate whether pairs of nodes are adjacent or not in the graph. for a directed graph, element (i,j) of the adjacency matrix represents a directed edge between nodes i and j. When the directed graph is acyclic (as Bayesian network graphs are), the adjacency matrix is triangular.
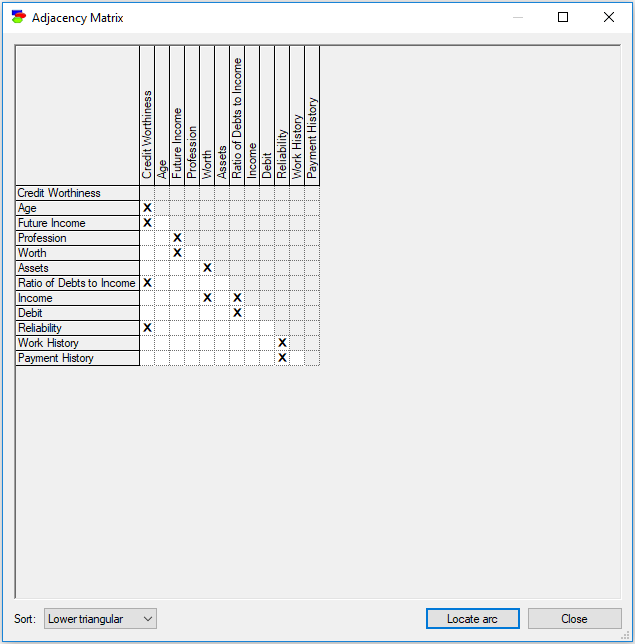
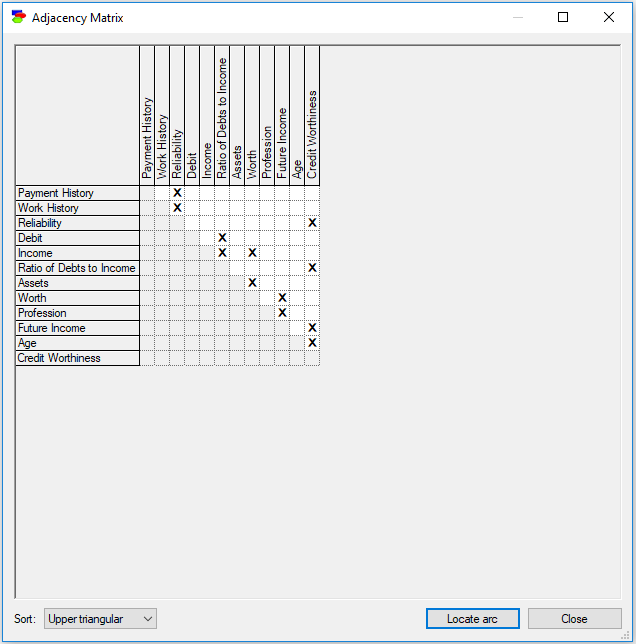
The adjacency matrix can be viewed in three different modes. The default is the lower-triangular view (see above). The two alternative views are upper-triangular
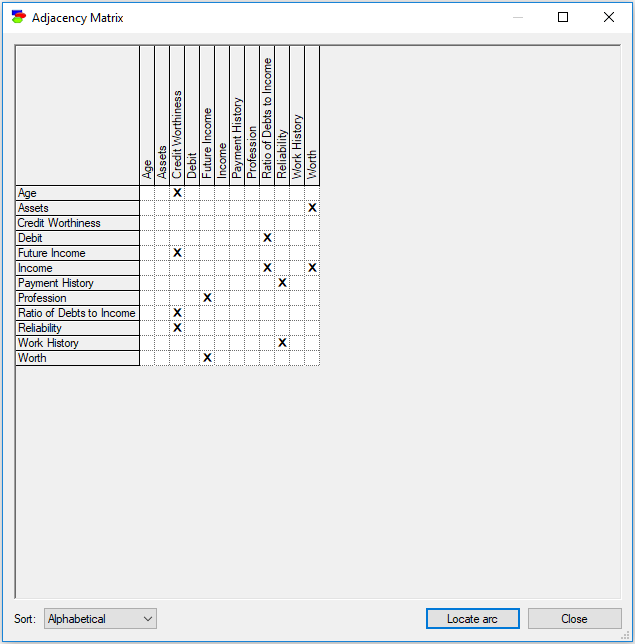
and alphabetical
Every X in the adjacency matrix represents an edge in the directed graph of a Bayesian network. Selecting an X and pressing on the Locate arc button shows the arc in the Graph view window.
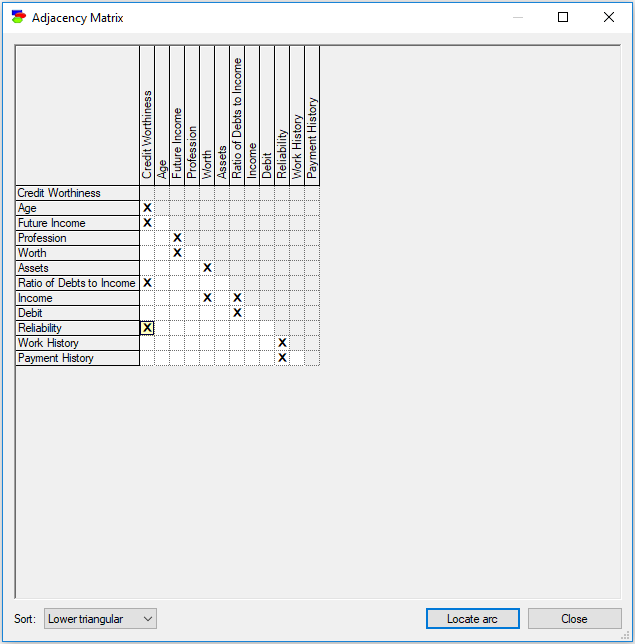
The X selected in the above picture corresponds to an arc from the node Reliability to the node Credit Worthiness