This section offers an informal introduction to GeNIe, similar to the light introduction to the C programming language offered by Brian Kerninghan and Dennis Ritchie in their milestone book (see Kernighan & Ritchie, 1988). We will show you how to create a simple Bayesian network model, how to save and load it, and how to perform Bayesian inference with it. Bayesian networks are just one of several powerful modeling tools implemented in GeNIe. Once you have made yourself familiar with GeNIe in this informal way, you can proceed with the Using GeNIe chapter, which offers a thorough introduction to various functional modules of GeNIe.
We will sketch the basic functionality of GeNIe on a simple example. While this example contains only two variables, it illustrates all basic concepts, which once understood can be used in building more complex models. Please keep in mind that the functionality covered in this section merely touches one functionality of GeNIe, Bayesian networks. It just gives you a taste of Bayesian modeling.
Consider the following scenario:
Imagine a venture capitalist who considers a risky investment in a start-up company. A major source of uncertainty about her investment is the success of the company. She is aware of the fact that only around 20% of all start-up companies succeed. She can reduce this uncertainty somewhat by asking expert opinion. Her expert, however, is not perfect in his forecasts. Of all start-up companies that eventually succeed, he judges about 40% to be good prospects, 40% to be moderate prospects, and 20% to be poor prospects. Of all start-up companies that eventually fail, he judges about 10% to be good prospects, 30% to be moderate prospects, and 60% to be poor prospects.
How can our investor use the information from the expert? What is the chance for success if the expert judges the prospects for success to be good? What if he judges them to be poor?
We will create a Bayesian network that will allow us to determine the exact numerical implications of the expert's opinion on the investor's expectation of success of the venture. The Bayesian network will contain two nodes representing random variables: Success of the venture and Expert forecast.
If you have not already started GeNIe, start it now.
The Tools Menu shows a list of different types of nodes that you can create. These are also displayed as buttons on the Standard Toolbar.
A. Let us create the node for the variable Success of the venture.
Click Chance button (![]() ) from the Standard Toolbar or Tools Menu.
) from the Standard Toolbar or Tools Menu.
The Chance button will become recessed and the cursor will change to an arrow with an ellipse in bottom right corner. Move the mouse to a clear portion of the screen inside GeNIe window (the main model window is called the Graph View) and click the left mouse button. You will see a new node appearing on the screen as shown below:

The small squares around the node indicate that the node is selected. The most recently created node is automatically selected. You can also select any node by clicking on it. You can change the size of the selected node by dragging the small squares.
If you want to draw multiple nodes of the same type, then you can avoid having to select the node button again and again by double-clicking on the corresponding node button instead of single-clicking it. This will place you in "sticky mode," in which the tool button stays recessed and you can draw multiple nodes of that type. You can return to normal mode by clicking on the Select Objects button (![]() ) or clicking on the recessed button again.
) or clicking on the recessed button again.
Once you have drawn the node on the Graph View, the Chance button on the toolbar will become normal again and the Select Objects button will become recessed.
GeNIe associates two labels with each node: an identifier and a name. Identifiers are similar to variable names in programming languages: they should start with a letter followed by any sequence of letters, digits or underscore characters. Letters are a-z and A-Z but also all Unicode characters above codepoint 127, which allows using characters from other alphabets than the Latin alphabet. Names are simply strings of characters with no limitations. GeNIe assigned the node that you have just created both the identifier and the name Node1. GeNIe also places a newly created node's name in Edit mode immediately, so you can enter a more descriptive name if you want.
B. Let us assign a meaningful identifier and a name for the newly created node.
Double click on the node Node1.
GeNIe will display the following dialog box:
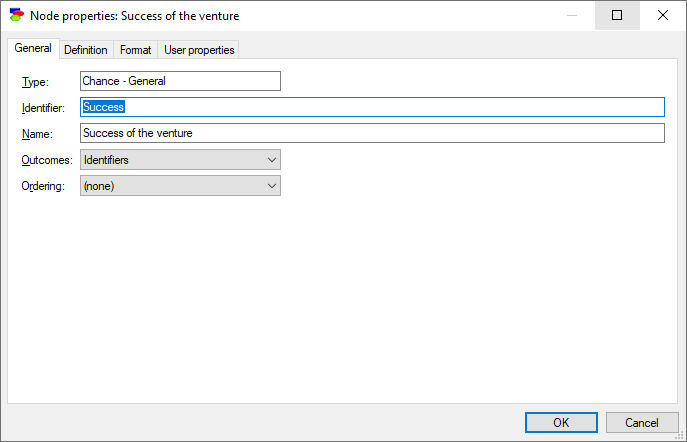
These are the Node Property Sheets, which are used to specify various properties of the node.
Now, change the identifier to Success and the name to Success of the venture.
C. We will define the outcomes of this variable (node) and their probabilities. We can do this from the Definition tab of the Node Property sheets.
1. Click on the Definition tab
GeNIe will display the following dialog:
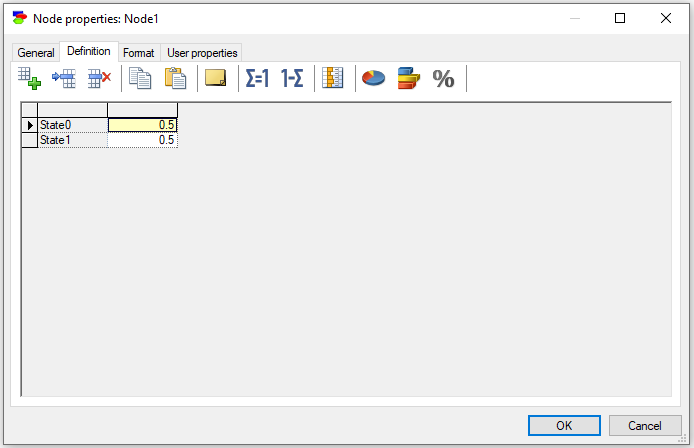
2. Double-click on the identifier of the first state, and change its name to Success.
3. Similarly rename State1 into Failure.
You may also select the states of the node from a Quick States list at the time of creating a new chance node in the Graph View. To do so, select ![]() (Chance button) from the Standard Toolbar or Tools Menu. The Chance button will become recessed and the cursor will change to an arrow with an ellipse in bottom right corner. Move the mouse to a clear portion of the screen inside GeNIe window, hold the SHIFT key on the keyboard and click the left mouse button. The following menu with Quick states list for the nodes will pop up:
(Chance button) from the Standard Toolbar or Tools Menu. The Chance button will become recessed and the cursor will change to an arrow with an ellipse in bottom right corner. Move the mouse to a clear portion of the screen inside GeNIe window, hold the SHIFT key on the keyboard and click the left mouse button. The following menu with Quick states list for the nodes will pop up:
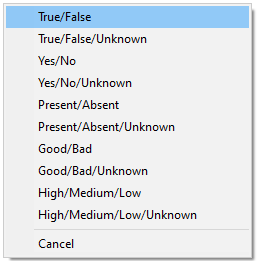
Select the states that are relevant to your node, for example if you want the chance node to have states Present & Absent, select this option from the menu and click the left mouse button. You will now see a new node on the screen. If you double click the node button and select the Definition tab. The following dialog box pops up:

If the required states of the node are not listed in the pop up menu, please select Cancel option from the pop-up menu and then just left-click anywhere in the Graph View. This will create a binary node with default states State0 and State1. You can change the names of these states to Success and Failure interactively.
Now let us enter the probabilities of occurrence of each of the states. In building GeNIe, we followed the design rule that any model, even in the middle of its construction, is always syntactically correct. Whatever you create interactively in GeNIe, may be gibberish but it will always compose a mathematically correct model. In this spirit, GeNIe creates a new node with an explicitly defined probability distribution, which we chose to be the uniform distribution. For a node with two states, GeNIe sets the probabilities to 0.5 and 0.5, i.e., both states are equally likely.
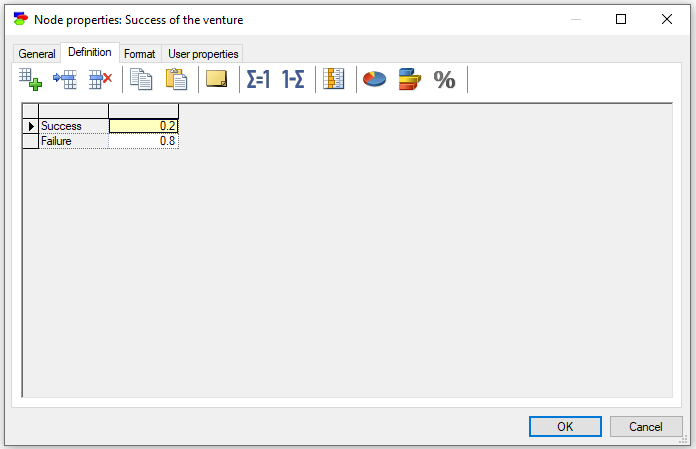
We want to set P(Success) to 0.2 and P(Failure) to 0.8. This expresses our knowledge that other information absent, the chance that this business will succeed is 20% (on the average, 80% of start-up businesses fail). To change the current 0.5 and 0.5 probabilities, do the following:
4. Double click on the value field for the Success state and enter 0.2.
5. Select the probability for the Failure state (currently 0.5).
6. Click on the Complement (![]() ) button. This will set the value field to 0.8, which is 1-0.2, so that the sum of probabilities is equal to 1.0.
) button. This will set the value field to 0.8, which is 1-0.2, so that the sum of probabilities is equal to 1.0.
The Complement button simply subtracts the sum of the probabilities in the same column from 1 and adds the remainder to the selected field.
If the sum of probabilities for all the states does not add up to 1.0, you can select the distribution in question and press the Normalize (![]() ). This is a convenient function if you prefer to enter probabilities as percentages. Entering 20 and 80 for the states Success and Failure respectively and pressing the Normalize button will change them to 0.2 and 0.8.
). This is a convenient function if you prefer to enter probabilities as percentages. Entering 20 and 80 for the states Success and Failure respectively and pressing the Normalize button will change them to 0.2 and 0.8.
Probabilities can also be entered graphically using a probability wheel or a bar chart. We will cover these later on but if you want, you can explore these now.
After you are done, the tab should look as follows:
We are done defining the properties for this node.
7. Press the OK button to return to the Graph View.
D. Now let us create the node for the variable Expert forecast.
Click on the Chance button and then place below the previously created node in the Graph View.
Your Graph View will look similar to this:
The label for the "Succ..." node is not completely displayed because we have changed the text inside the properties tab but not adjusted the node size. You can adjust the size of the node to fit the text by selecting it and dragging one of the small squares. You can also select multiple nodes and drag on one of them, which will result in all nodes being change at the same time. GeNIe offers also a semi-automatic way of adjusting node size. To do so, right click on the node and select Resize to Fit Text from the node pop-up menu. The node will become larger and will display the entire "Success of the venture" label.
The newly created node will represent the expert's prediction.
E. In order to represent the fact that the expert's prediction depends on the actual prospects for success, we will create an influence arc between the two nodes.
Click on the Arc (![]() ) tool (note that the cursor changes), then click on the Success of the venture node, hold the left mouse button and drag the mouse to the new node (Node2), and release the button anywhere within the new node.
) tool (note that the cursor changes), then click on the Success of the venture node, hold the left mouse button and drag the mouse to the new node (Node2), and release the button anywhere within the new node.
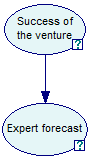
GeNIe will draw an arc from Success of the venture node to Node2. The diagram will now look as follows:
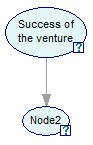
The arc between the two nodes means that whether or not the venture is going to be successful makes a difference for the probability distribution over various statements made by the expert (this is going to be expressed by the conditional probability distributions over Node2). After we first draw an arc, it is typically dimmed. This is a feedback from GeNIe stating that the arc is superfluous and does not make any difference for the dependence of the two nodes. It is because we have not yet defined the numerical influence of the parent on the child. We will fix it in Step F.
F. Now, let us define the properties of the new node.
1. Double-click on Node2.
2. Change its Identifier and Name to Forecast and Expert forecast, respectively.
3. Click on the Definition tab.
4. Rename the two states (State0 & State1) to Good and Moderate.
The screen should look as follows:
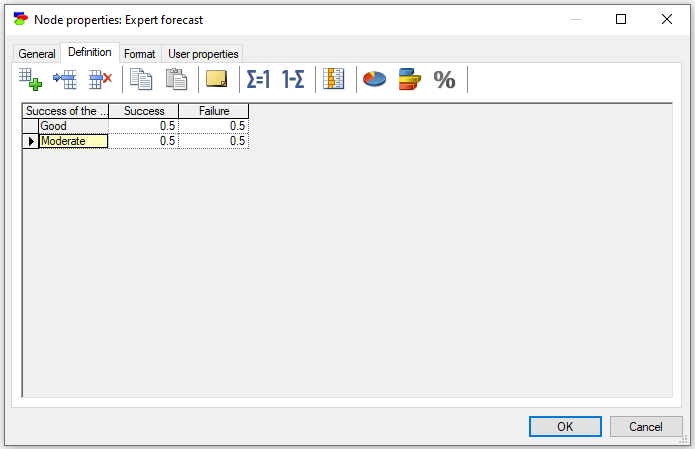
But the expert's forecast can have three possible values: Good, Moderate, and Poor. We have defined only two states, Good and Moderate. To define the state Poor, we need to add one more state.
5. Click on the Add Outcome (![]() ) button. This will add a new state named State2 below the state Moderate.
) button. This will add a new state named State2 below the state Moderate.
6. Rename the newly added state to Poor.
7. Now you can enter the probabilities for each state combination. We suggest that you use the values shown below:
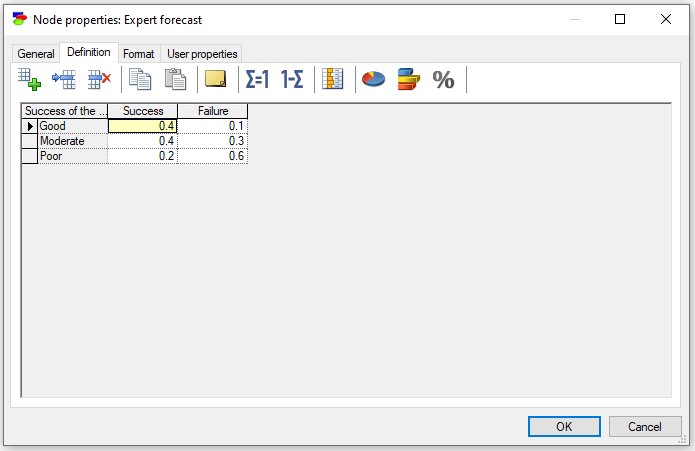
The probability table above encodes the conditional probabilities of different expert forecasts for all possible actual prospects of the investment. (In general, a node with parents will encode the conditional probability distributions over the node for all possible combinations of outcomes of these parents.) For example, the first column encodes our knowledge that if the prospects are good (the venture is going to succeed), the expert will designate it as Good with chance 0.4 (40%), as Moderate with chance 0.4 (40%), and as Bad with a chance 0.2 (20%). Similarly, the second column encodes our knowledge that the expert will designate an eventually failing venture as Good, Moderate, and Poor 10%, 30%, and 60% of the time.
8. Click OK to accept all changes and return to the Graph View.
You may want to resize the "Exper..." node so that the entire name of the node is visible.
9. Right-click on the node and select Resize to Fit Text from the menu. The node will become larger and will display the Expert Forecast label.
If you want to align the two nodes to make the graph look neater, select both the nodes and click on the Align Centers (![]() ) button on the Format Toolbar.
) button on the Format Toolbar.
Your network should look like this:
G. At this point you should save your work.
1. Click on Save button (![]() ) on the Standard Toolbar.
) on the Standard Toolbar.
GeNIe will display the Save As.. dialog shown below:
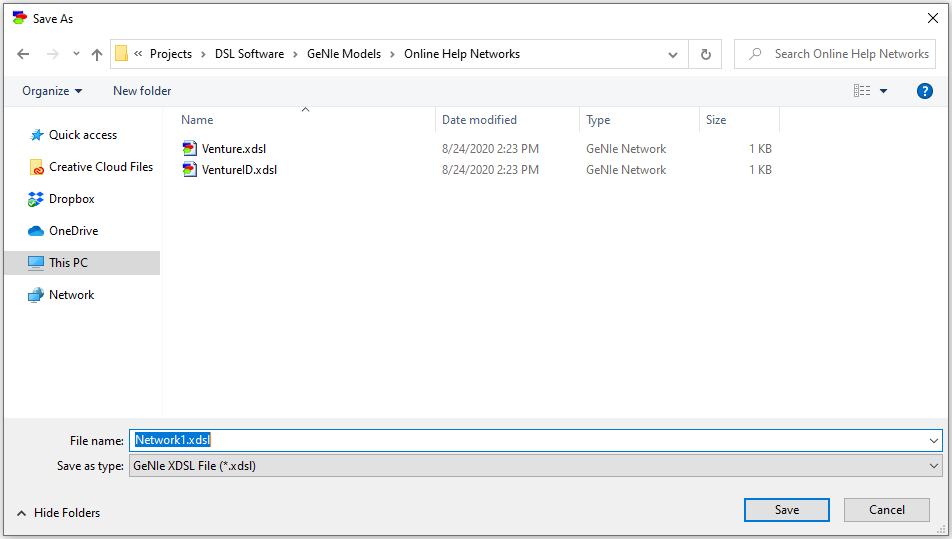
2. Enter VentureBN as the File name and click on Save.
H. Now let us put our model to work and answer the questions posed in the beginning of this tutorial.
To answer the question What is the chance for success if the expert judges the prospects for success to be good?, you will need to tell GeNIe that you have observed a value of the Forecast variable to be Good and ask it to update its probability distribution over the variable Success. There are several ways of doing this.
1. Right-click on the variable Expert forecast and choose Set evidence / Good.
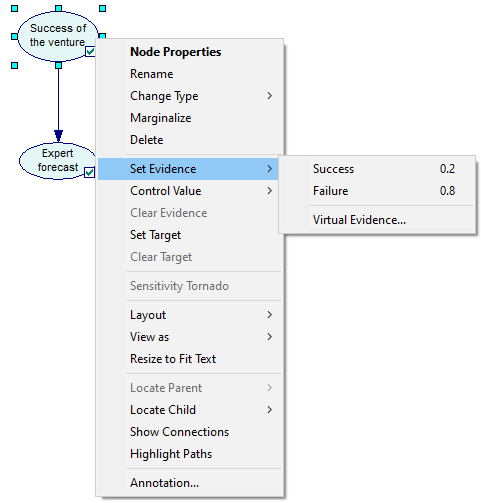
Note that the status icon on the bottom right of the node changes from ![]() to
to ![]() . This indicates that the node has been observed.
. This indicates that the node has been observed.
2. Click on the Update tool (![]() ) on the Standard Toolbar.
) on the Standard Toolbar.
This updates the probability distributions in light of the observed evidence. Notice that the status icon for the Success of the venture node changes to ![]() from
from ![]() .
.
3. Move the mouse cursor over the ![]() for the Success of the venture node.
for the Success of the venture node.
This will display the posterior probability distribution over the Success of the venture node:
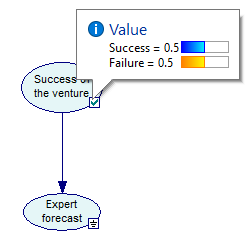
We see that expert's forecast Good has changed the probability of Success of the venture from 0.2 to 0.5.
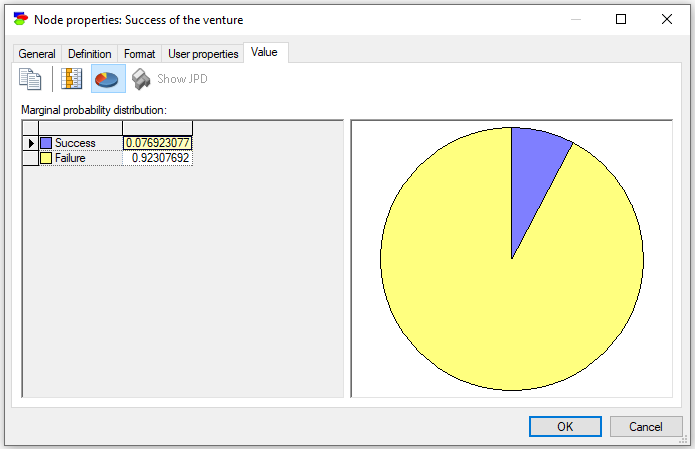
To answer the second question What if he judges them to be poor?, we will set the evidence in the node Expert forecast to Poor, update the model, and observe that the probability of success is now less than 0.08.
Results of Bayesian updating can be also viewed by double-clicking on a node and selecting the Value tab.
4. Double click on the Success of venture node.
5. Select Value tab from the Node Property sheets
The result should look as follows:
Entering evidence and displaying results can be done much simpler by changing node appearance from Icon to Bar Chart. To achieve this, first select all nodes that you want to display as bar charts (you can select them with a mouse or, if you want to change all nodes, you can select all nodes by pressing CTRL-A).
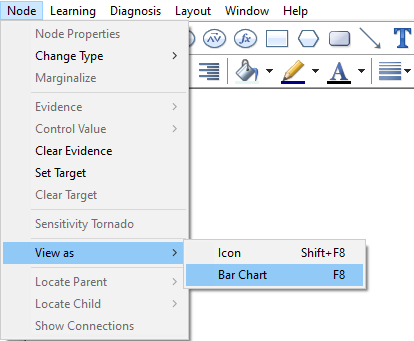
Changing this setting for all nodes can be also achieved by deselecting all nodes, in which case the View as / Bar Chart command will apply to all nodes. Also, set the Update Immediately flag:
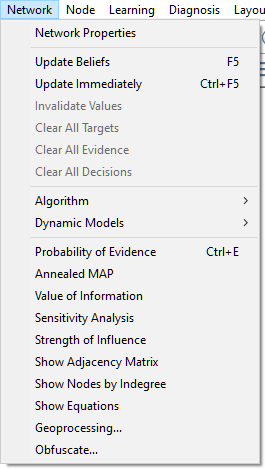
The Update Immediately flag, when set, invokes Bayesian inference as soon as any change happens to the model. It is convenient to have it turned off when we are still busy with building a model (to avoid computation when the model is incomplete and it does not make much sense yet) and turned on when the model is ready.
The network should look as follows:
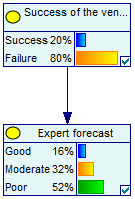
To observe a value, double-click on the bar that corresponds to it. To answer the first question, we double click on the state Good in the Expert forecast node. We observe the following:
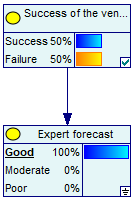
The evidence entered is marked by underlining the state and showing the bar to be 100%. The posterior marginal probability distribution and, hence, the answer to our question, is shown in the node Success of the venture.
What we created was a simple Bayesian network. You can create more complex models in a similar way.
You can find the above model named VentureBN.xdsl in the Example Networks directory among other example models that come with GeNIe.