One of the important elements of probabilistic modeling is the ability of directed probabilistic graphs to represent the causal structure of a modeled domain. The structure itself is very valuable and is an important source of insight. An important element of model analysis is the structure itself, viewing the strengths of influences and pathways through the graph. We describe viewing the strengths of influences in the Strength of influences section. This section describes tools for the analysis of the graph structure.
Dimming unnecessary arcs
Dimming unnecessary arcs, discussed earlier in this manual, is a simple but important modeling tool that allows for finding one class of modeling errors, errors of omission. When the probability distributions in a conditional probability table are such that a parent's state makes no difference, the arc between the parent and the node is not necessary. This is often the case when building a model - because GeNIe makes sure that a model is always correct (this was our important design principle), it puts uniform distributions in all columns of the node's conditional probability table. Whenever an arc is added, distributions are copied and are identical for all states of the parent node. When the model under construction is sufficiently large, it is very easy to forget about refining them. Because unnecessary arcs are dimmed, it is clearly visible which arcs still need modeling attention. Without this cue, in a sufficiently large model under construction, it would be easy to forget about refining node definitions.
Real numbers are rarely identical, so the Probability distance threshold (Hellinger) is a setting that allows for approximate equality of distributions. When two distributions are equal up to the threshold, they are considered equal. Utilities are not distributions, so when they are compared, the second setting (Normalized utility distance threshold (%)) is used. When two utilities differ less than the indicated percentage, they are considered equal. The details of these settings are described in section Program options, General Tab.
Whenever you see a dimmed arc, please have a look at the definition of the child node - chances are that it is not that the arc is unnecessary but rather that you have forgotten to define the interaction between the child node and its parents.
Locating disconnected nodes
When modeling, many a user create a collection of nodes and then connect them by means of arcs. When the model under construction is sufficiently large, it is not uncommon to forget about some of the nodes and leave them unconnected to the rest of the network. Select disconnected nodes is a functionality that helps to find such nodes so that we can give them more attention. To find disconnected nodes, please select Select Disconnected Nodes from the Edit Menu:
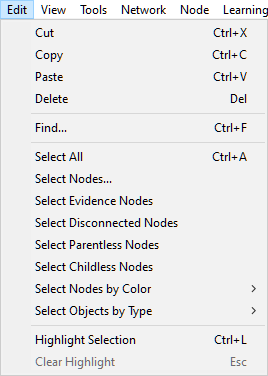
If there are no disconnected nodes in the model, this choice is going to be grayed out. Nodes selected can be subsequently highlighted (choice Highlight Selection or Ctrl-L in the Edit Menu or pressing the Highlight selection button ![]() ) and easily located in the Graph View visually.
) and easily located in the Graph View visually.
Finding nodes with high in-degree
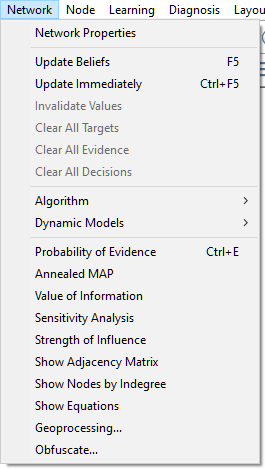
Inference in Bayesian networks is worst-case NP-hard, which typically means that algorithms updating a Bayesian network will require an exponential amount of memory or computation time. One factor that influences the complexity of inference is the network connectivity. In turn, an important factor in the network connectivity is node in-degree (the number of parents of a node) because the size of the conditional probability table in a node is exponential in the number of parents of that node. GeNIe allows for finding nodes with high in-degree through the function Show Nodes by Indegree in the Network Menu.
This function displays the following dialog
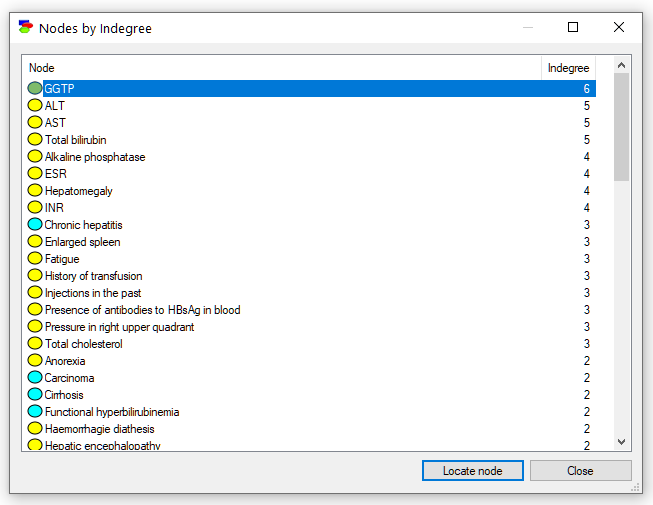
The dialogs shows a list of all nodes in the model with their in-degree. The nodes are sorted by their in-degree (from the highest to the lowest). Selecting any node on the list and pressing the Locate node button (or just double-clicking on the node) finds the node in the Graph View of the model. In case of any problems with inference, it is advisable to find those nodes that have high in-degree and to try to reduce their number of parents. Often this is possible by removing weaker connections or by a technique known as "parent divorcing," (mentioned in section on Computational complexity).
Neighborhoods
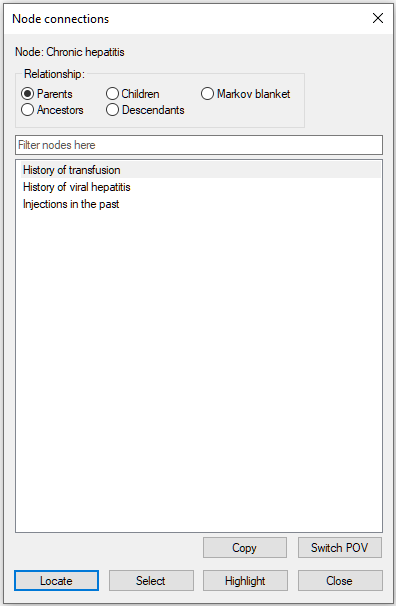
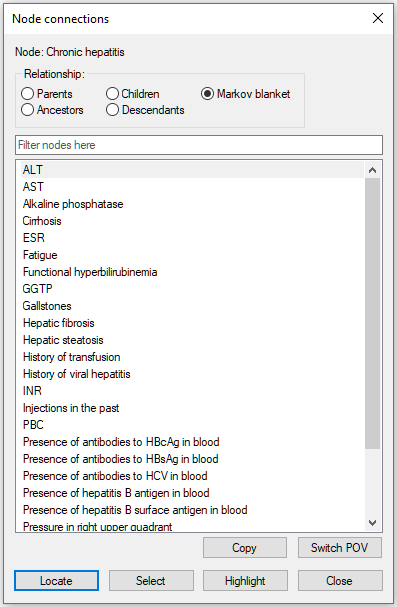
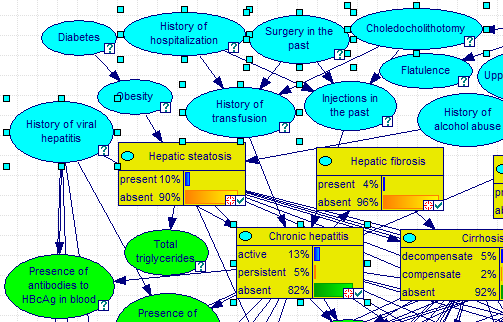
There are several useful functions that help with analysis of connections and pathways through the directed graph. One group of such functions is showing connections of a selected node. To open the connections dialog, please select Show Connections from the context menu of the node in question. The image below show invoking the dialog for the node Chronic hepatitis in the Hepar II network.
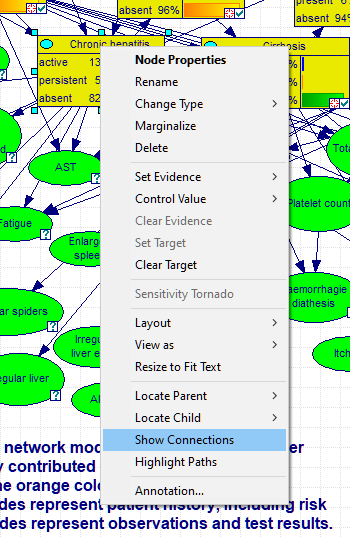
The dialog allows for selecting parents (direct predecessors in the graph), children (direct successors in the graph), family (parents and the node itself), ancestors (all predecessors in the graph), descendants (all successors in the graph), and the node's Markov blanket (the set of nodes that make the selected node independent of the other nodes in the graph). There are three parents of the node Chronic hepatitis in the graph.
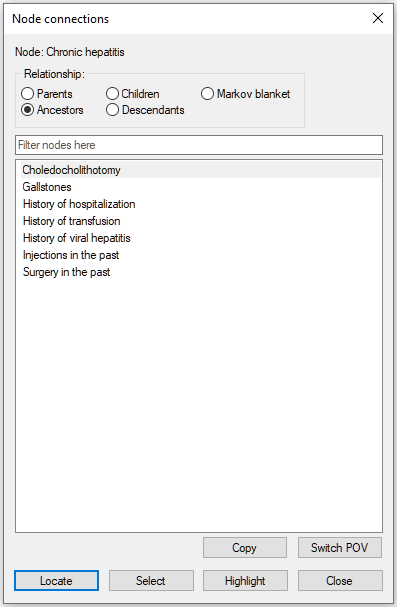
The three nodes belong also to the ancestors of the node Chronic hepatitis.
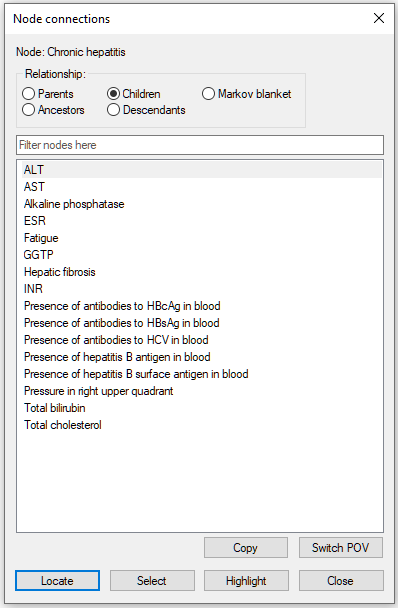
The node Chronic hepatitis has 16 children:
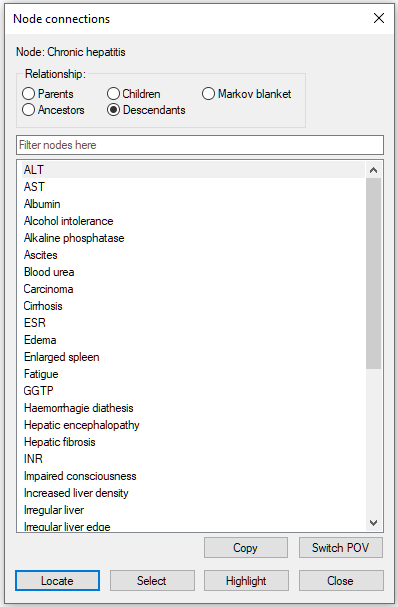
They all belong to the descendants of Chronic hepatitis:
Parents, children, and the parents of those children belong to the Markov blanket of the node Chronic hepatitis:
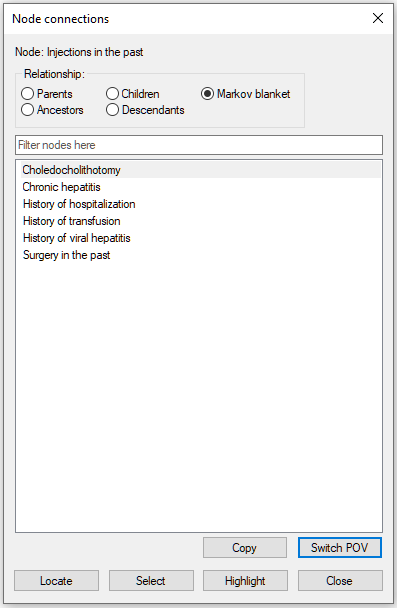
The dialog allows for traversing the graph through changing the focus of the analysis. A new focus can be chosen by selecting it from the list of nodes and pressing the Switch POV (Point of View) button in the lower-right corner of the dialog. Let us select History of transfusion and press the Switch POV button.

Selecting Injections in the past and pressing the Switch POV button leads to refocusing the neighborhood to the node Injections in the past.
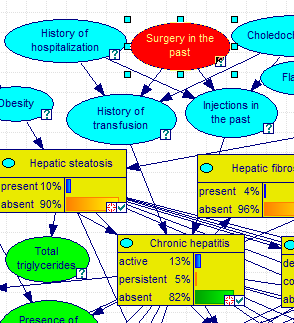
Selecting any of the nodes on the list and pressing Locate button locates the node in the Graph View and flashes the node three times. Double-clicking on the selected node has the same effect. Selecting Surgery in the past and pressing the Locate button yields:
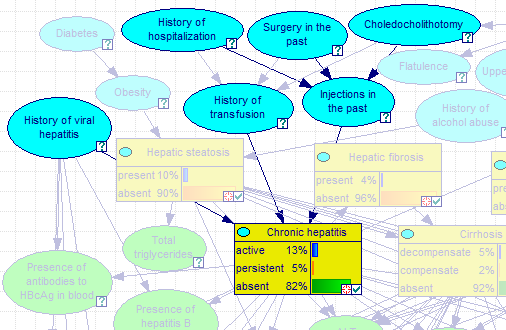
Pressing the Highlight button exits the dialog and highlights all nodes on the list, including the POV node and all arcs connecting the nodes. In the image below, Highlight button was pressed when the Node connections dialog showed the Markov blanket of the node Injections in the past.
Pressing ESC or choosing Clear Highlight from the network pop-up menu will clear the selection.
Pressing Select button in the Show Connections dialog selects all nodes on the list (selection does not include the POV node!) in the Graph View. In the image below, Select button was pressed when the Node connections dialog showed the Markov blanket of the node Injections in the past.
This selection can be further enhanced through other ways of selecting nodes and arcs. Please see the Select Nodes... dialog, described in the Selection of model elements section.
Pathways of information flow
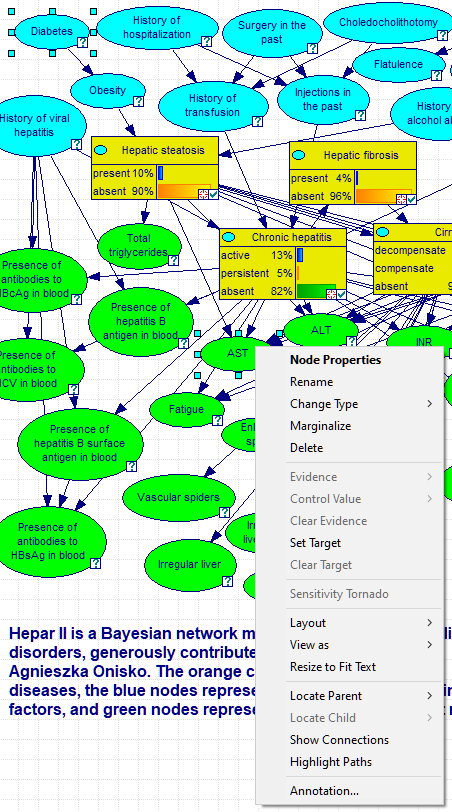
GeNIe allows for showing active paths through which information flows between a pair of nodes. To show all paths between two nodes A and B, please select these two nodes and choose Highlight Paths from the node context menu of one of the two nodes. The following image shows how to invoke highlighting paths between the nodes Diabetes and AST.
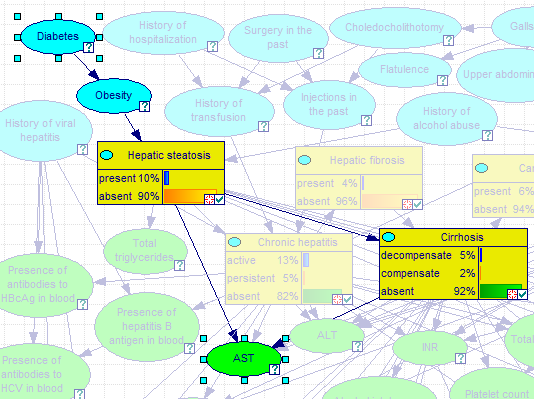
The result of choosing Highlight Paths above is
Pressing ESC or choosing Clear Highlight from the Network pop-up menu will clear the selection.