Clicking on the Strength of Influence (![]() ) tool from the Standard Toolbar, brings up the Influence Toolbar and also changes the appearance of the arcs in the network. The arc have different thickness, dependent on the strength of influence between the nodes that they connect. Strength of influence is calculated from the CPT of the child node and essentially expresses the distance between various conditional probability distributions over the child node conditional on the states of the parent node. This is a GeNIe only feature, i.e., there is no equivalent of this functionality in SMILE. It serves the purpose of visual analysis and verification of models during their construction.
) tool from the Standard Toolbar, brings up the Influence Toolbar and also changes the appearance of the arcs in the network. The arc have different thickness, dependent on the strength of influence between the nodes that they connect. Strength of influence is calculated from the CPT of the child node and essentially expresses the distance between various conditional probability distributions over the child node conditional on the states of the parent node. This is a GeNIe only feature, i.e., there is no equivalent of this functionality in SMILE. It serves the purpose of visual analysis and verification of models during their construction.
Basic functionality
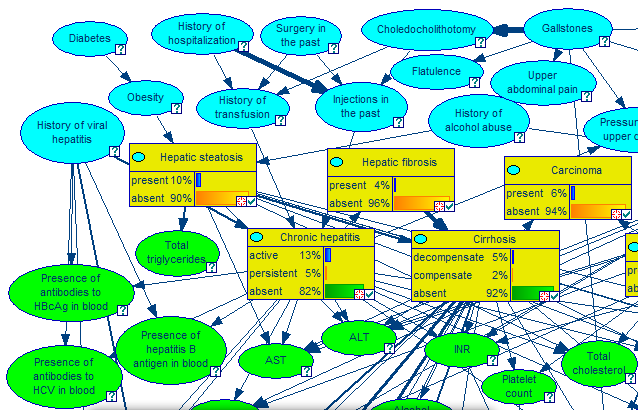
Here is a fragment of the Hepar II network with the Strength of Influence tool (![]() ) pressed.
) pressed.
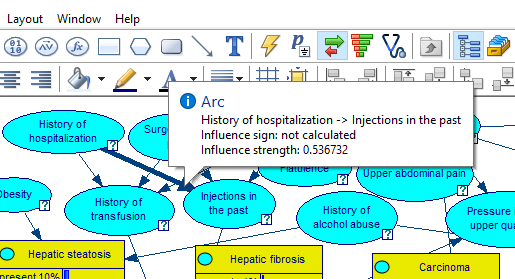
If the mouse is placed on the head of the arrow, information relating the strength of influence is shown in a comment box as shown below.
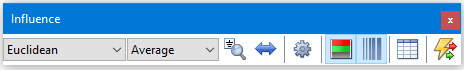
The Influence Toolbar allows to choose various options related to the calculation and display of strengths of influence. It is by default detached from the tool bars and can be moved to any position on the screen.
Selection of display mode
Thickness of arcs can be based on one of the three: Average (default), Maximum, and Weighted
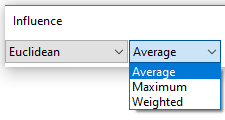
Maximum uses the largest distance between distributions, Average takes the plain average over distances, and Weighted weighs the distances by the marginal probability of the parent node. In our experience Maximum can give better insight into the strength of influence, as it indicates the largest possible change in the posterior distribution over the child node given a state of the parent node. An important source of information may have a low average but be capable of making a big change if one of its states is observed.
The Normalize (![]() ) button toggles between the normalized and non-normalized mode. In normalized mode, the thickest possible arc is given to that arc that has the highest strength of influence. The thicknesses of all other arcs are calculated proportionally to the thickest arc. In the non-normalized mode (default), thickness is based on the absolute value of the distance.
) button toggles between the normalized and non-normalized mode. In normalized mode, the thickest possible arc is given to that arc that has the highest strength of influence. The thicknesses of all other arcs are calculated proportionally to the thickest arc. In the non-normalized mode (default), thickness is based on the absolute value of the distance.
Measures of distance between distributions
There are four measures of distance between distributions used by this functionality: Euclidean (default), Hellinger, J-Divergence, and CDF. A good source of information about the four measures is (Koiter, 2006).
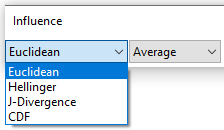
The J-Divergence has an additional setting, which can be changed by pressing the Alpha (![]() ) button. The alpha parameter controls normalization of the J-Divergence.
) button. The alpha parameter controls normalization of the J-Divergence.
Other settings
Influence shown can be Static or Dynamic. The Static mode only makes use of the conditional probability tables present in the model and is, therefore, not context-dependent. The thickness of the arcs indicates the strength of influence that a parent has on a child, while the colors of the arcs shows the sign of that local influence. The Dynamic mode, invoked by pressing the Show dynamic influence button (![]() ) is context-specific and essentially shows the potential influence that two directly connected nodes can have on each other. In the dynamic mode, the Recalculate influence (
) is context-specific and essentially shows the potential influence that two directly connected nodes can have on each other. In the dynamic mode, the Recalculate influence (![]() ) button can be used to recalculate the thickness and coloring of arcs. This is needed when, for example, a new piece of evidence has been observed.
) button can be used to recalculate the thickness and coloring of arcs. This is needed when, for example, a new piece of evidence has been observed.
Use arc thickness to show strength (![]() ) button allows for turning the arc thickness on and off from the Influence toolbar. When the Use color to show sign (
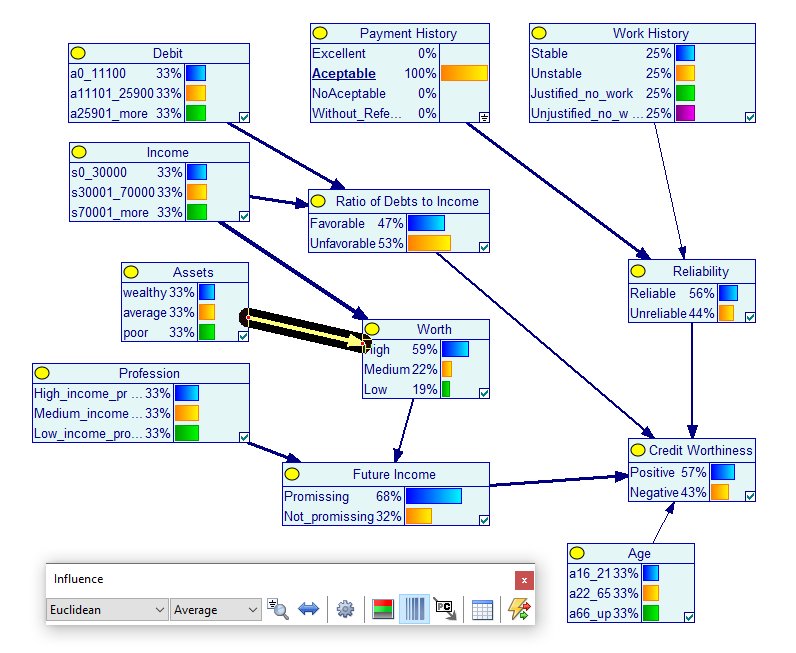
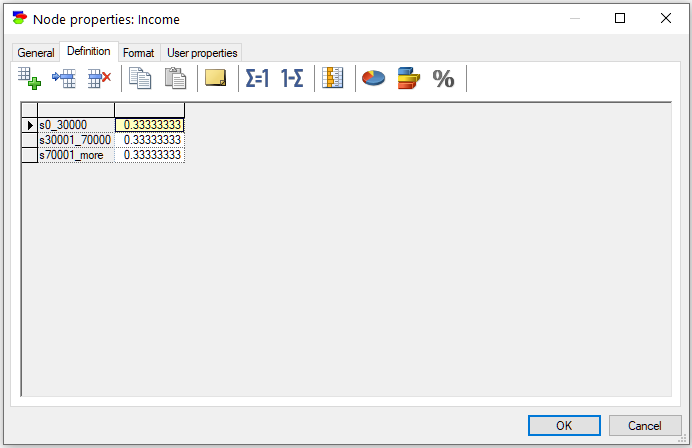
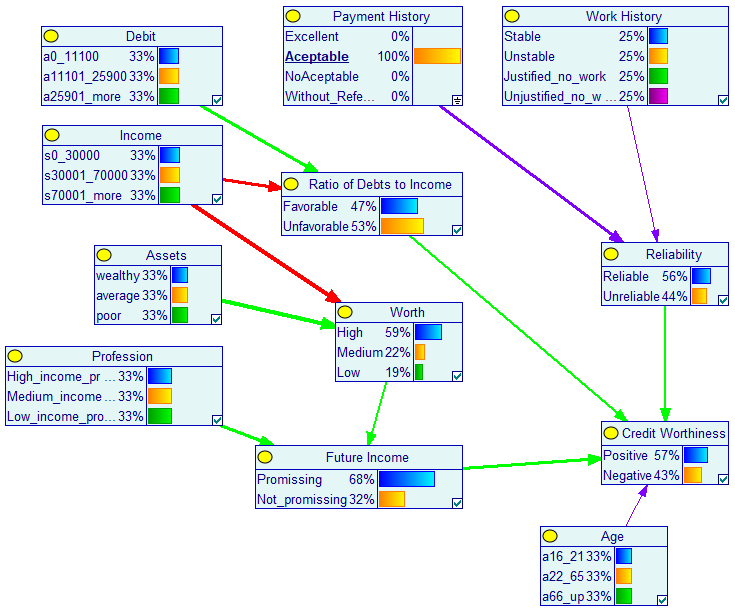
) button allows for turning the arc thickness on and off from the Influence toolbar. When the Use color to show sign (![]() ) button is pressed, coloring of the arcs is activated. Colors indicate the sign of influence. This sign can be positive (green), negative (red), null (gray), or ambiguous (purple). There are different colors for static and dynamic modes. For the signs of influences and, hence, colors to be calculated, one has to specify first the Outcome order on the child node's Node properties's General tab (either Low to high or High to low). Consider, for example the variable Income in the Credit.xdsl model. Its definition is as follows:
) button is pressed, coloring of the arcs is activated. Colors indicate the sign of influence. This sign can be positive (green), negative (red), null (gray), or ambiguous (purple). There are different colors for static and dynamic modes. For the signs of influences and, hence, colors to be calculated, one has to specify first the Outcome order on the child node's Node properties's General tab (either Low to high or High to low). Consider, for example the variable Income in the Credit.xdsl model. Its definition is as follows:
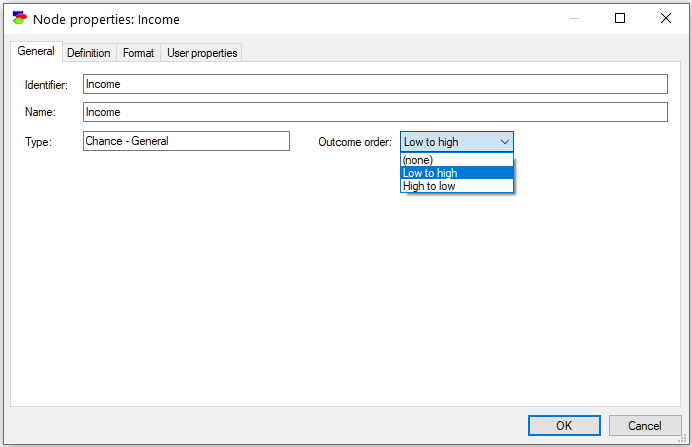
GeNIe needs to know the meaning of the order of outcomes for it to compute the sign of influence. The order of outcomes (clearly from low to high in this case) can be set on the General tab of Node properties:
Once we do this for all nodes in the model, GeNIe will be able to calculate and display the signs of individual influences. The following screen shot displays colored arcs for the Credit.xdsl model
List of arcs
Pressing the Show arc list button (![]() ) invokes the Strength of Influence dialog, showing the list of all arcs in the model, along with their strengths
) invokes the Strength of Influence dialog, showing the list of all arcs in the model, along with their strengths
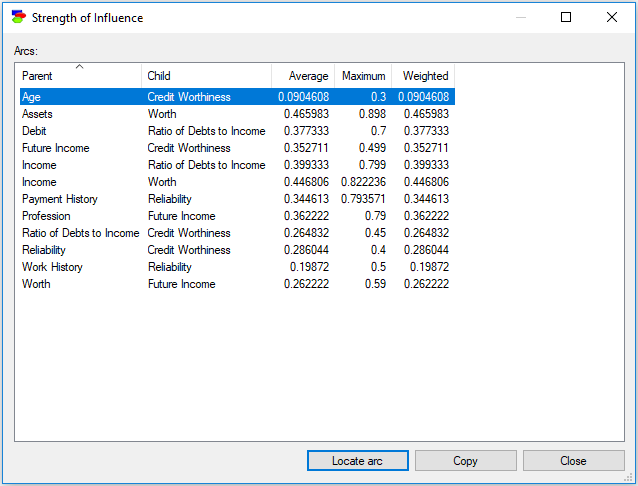
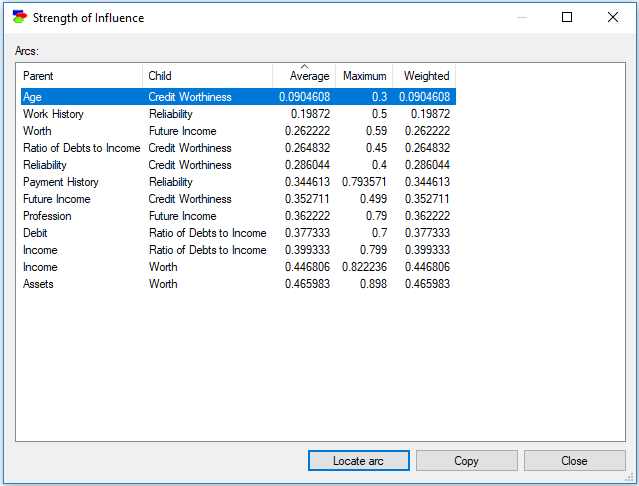
To sort the list by any of the columns, click on the column header. Clicking again will change the order from increasing to decreasing.
The Copy button allows for copying the content of the table to be copied to the clipboard for a later paste into a text editor. Individual elements of the table are separated by TAB characters, which makes it easy to paste the table into a spreadsheet program like Microsoft Excel, for example.
Pressing the Locate arc button locates the arc in the Graph View.