Marginal probability distributions
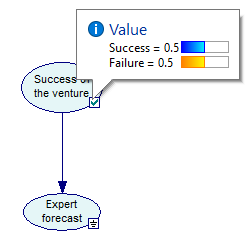
Once a model is evaluated, you are ready to view the results computed by GeNIe. This can be done in several ways. Posterior marginal probability distribution over any node in a Bayesian network can be viewed by hovering the cursor over the status icon when it is Updated (![]() ). The probabilities of the various states of the node will be displayed as follows:
). The probabilities of the various states of the node will be displayed as follows:
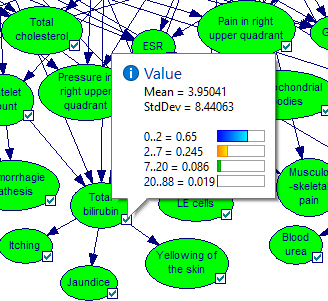
For nodes that are discrete numerical, GeNIe shows the probability distribution over their states but also calculates the mean and standard deviation over their domains.
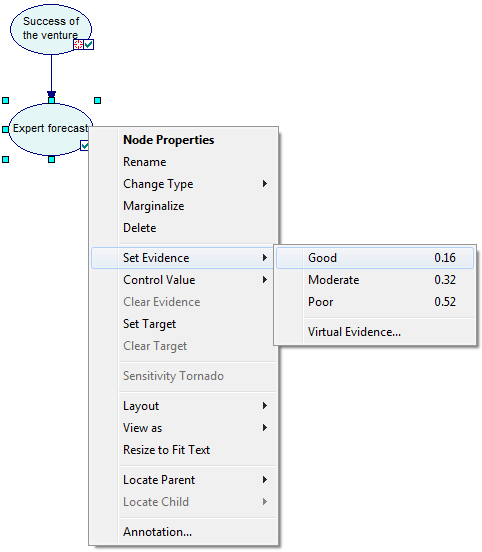
You can also right-click on the node and choosing Set Evidence. GeNIe shows a list of states of the node along with their probabilities, when these are available.
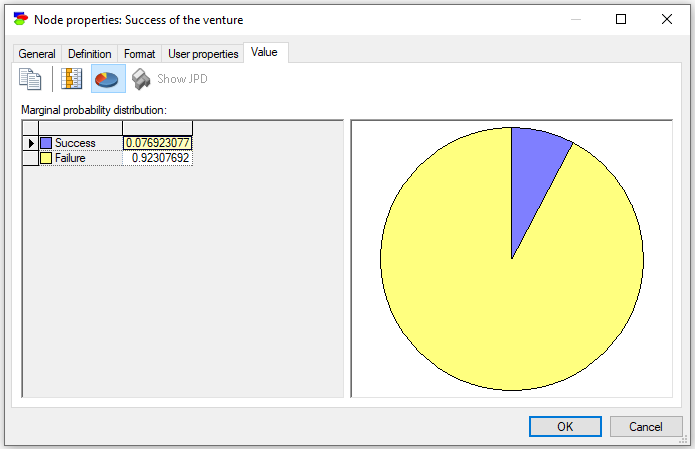
An alternative way of viewing the posterior probability distribution is to choose the Value tab from the Node Property Sheet. Shown below is the Value tab when the Expert forecast is Poor.
Posterior probability distribution in influence diagrams are more detailed. In cases when a node's probability distribution is affected by a decision or by a node that precedes a decision node, the posterior probability distribution is indexed by the outcomes of these nodes. In such cases, right clicking on a node icon will display a message The result is a multidimensional table, double click on the icon to examine it.
The only way to see the entire distribution, is by using the Value Tab of the decision node or the value node in question.
Joint probability distributions
Preservation of clique potentials allows for viewing joint probability distribution over those variables that are located within the same clique. Should you wish to derive the joint probability distribution over any variable set, just make sure that they are in the same clique before running the clustering algorithm. One way of making sure that they are in the same clique is creating a dummy node that has all these variables as parents. In any case, when the Preserve Clique Potentials flag is on, there is an additional button in the Value tab of Node Properties dialog, Show JPD (![]() ).
).
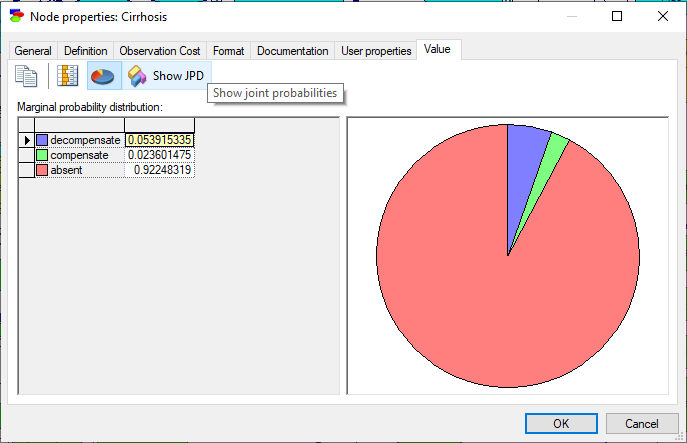
Pressing the Show JPD button invokes the following dialog:
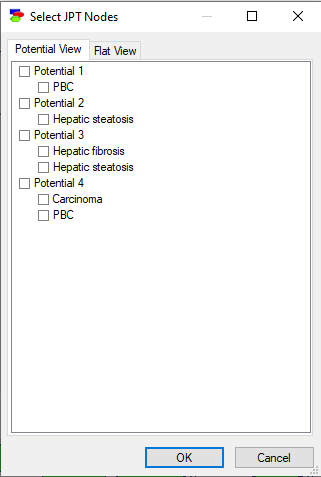
Only one potential can be viewed at the same time, although if the potential is large, one can select some variables within the same potential. The Flat view tab allows for a variable list view of the potentials.
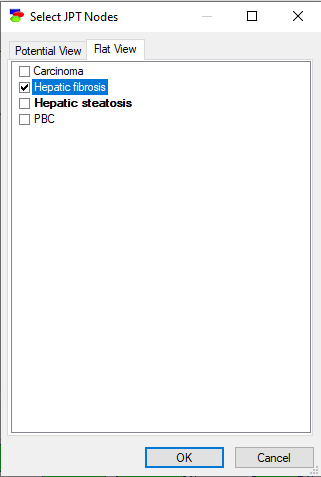
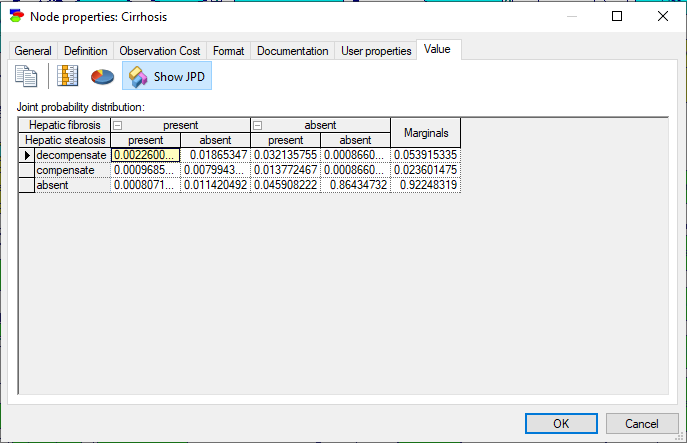
Selecting Potential 3 and pressing OK yields the following view with the joint probability distribution over variables Hepatic fibrosis and Hepatic steatosis.
The clustering algorithm is GeNIe's default algorithm and should be sufficient for most applications. Only when networks become very large and complex, the clustering algorithm may not be fast enough. In that case, we suggest the Relevance-based decomposition or a stochastic sampling algorithms, such as EPIS-BN (Yuan & Druzdzel, 2003), which is quite likely the best stochastic sampling algorithm available for discrete Bayesian networks.