Influence diagrams (Howard & Matheson 1984), sometimes also called relevance diagrams, are acyclic directed graphs representing decision problems. The goal of influence diagrams is to choose a decision alternative that has the highest expected gain (expected utility).
Similarly to Bayesian networks, influence diagrams are useful in showing the structure of the domain, i.e., the structure of the decision problem. Influence diagrams contain four types of nodes (Decision, Chance, Deterministic and Value) and two types of arcs (influences and informational arcs). The following influence diagram (available among the example models as VentureID.xdsl), discussed in detail in the section on influence diagrams, models a decision related to an investment in a risky venture:
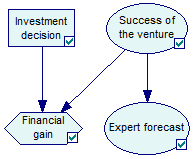
Nodes in an influence diagram represent various types of variables.
Chance nodes, usually drawn as circles or ovals (such as nodes Expert forecast and Success of the venture above) are random variables and they represent uncertain quantities that are relevant to the decision problem. They are quantified by conditional probability distributions, identical to those presented in the section on Bayesian networks. In fact, the subset of an influence diagram that consists of only chance nodes is a Bayesian network, i.e., an influence diagram can be also viewed as Bayesian network extended by decision and value nodes. When Decision nodes precede Chance nodes, they act exactly similar to those predecessors that are Chance nodes - they index the conditional probability table of the child node.
Decision nodes, usually drawn as rectangles (such as node Investment decision above), represent variables that are under control of the decision maker and model available decision alternatives, modeled explicitly as possible states of the decision node. They are closely related to Chance nodes but they are under full control of the decision maker and, therefore, specifying the probability distributions over their outcomes is pointless - we just specify their possible states. Node Investment decision in the above example model has two alternatives Invest and DoNotInvest.
![]()
Value nodes, usually drawn as diamonds (such as node Financial gain above), represent utility, i.e., a measure of desirability of the outcomes of the decision process. They are quantified by the utility of each of the possible combinations of outcomes of the parent nodes. Node Financial gain above is quantified in the following way:
![]()
Please note that value nodes are always continuous and their domains are the domains of the utility function.
Normally, an arc in an influence diagram denotes an influence, i.e., the fact that the node at the tail of the arc influences the value (or the probability distribution over the possible values) of the node at the head of the arc. Some arcs in influence diagrams have clearly a causal meaning. In particular, a directed path from a decision node to a chance node means that the decision (i.e., an intervention consisting of imposing a value on the decision node) will impact that chance node in the sense of changing the probability distribution over its outcomes.
Arcs coming into decision nodes are called informational arcs and have a different meaning. As decision nodes are under the decision maker's control, these arcs do not denote influences but rather temporal precedence (in the sense of the flow of information). The outcomes of all nodes at the tail of informational arcs will be known before the decision is made. In particular, if there are multiple decision nodes, they all need to be connected by informational arcs. This reflects the fact that the decisions are made in a sequence and the outcome of each decision is known before the next decision is made.