While Bayesian networks allow us to quantify uncertain interactions among random variables and use this quantification to determine the impact of observations, influence diagrams allow us to capture a decision maker's decision options and preferences and use these to determine the optimal decision policy. In order to build a decision model, a decision maker should clearly frame both the problem and the decision to be made.
Decision analysis rests on an empirically verified assumption that while it is relatively easy for humans to specify elements of decisions, such as available decision options, relevant factors, and payoffs, it is much harder to combine these elements into an optimal decision. This assumption, supported by a good number of empirical studies, suggests strongly that decisions should be supported by means of models. A model supports a decision by computing the expected value (or expected utility) of each decision alternative. The decision alternative with the highest expected gain is, by definition, optimal and should be chosen by the decision maker.
Consider the following scenario based on the example used in the Hello GeNIe! section. Let our venture capitalist consider investing $5,000 in the venture. She knows that if the venture is successful, she will earn an additional $10,000 on it. If it is not successful, she will lose her entire investment of $5,000. If she does not invest, her gain will be $500 from a risk-free investment in a bank. We will assume that our capitalist is interested only in financial gain. In case other factors play a role, such as intangible values or non-linearities in the intrinsic value of money, they can be captured by a measure known as utility. GeNIe supports expected utility calculation but leaves it to the user to learn how to measure and represent utility.
We will extend the simple Bayesian network built in the Hello GeNIe! section into an influence diagram by adding to it a decision node and a utility node. This is a general principle that is worth remembering: Bayesian networks describe the world, with its complexities and uncertainties, and influence diagrams describe what actions we can take in relation to this world and what values we can expect from these actions. We will use this influence diagram to evaluate two available policy options: Invest and DoNotInvest.
A. Open the Bayesian network created in the Hello GeNIe! section. You can find a copy of this Bayesian network in the Example Networks folder. It is named VentureBN.xdsl.
1. Click on the Open network (![]() ) button on the Standard Toolbar.
) button on the Standard Toolbar.
GeNIe will display the Open dialog as shown below:
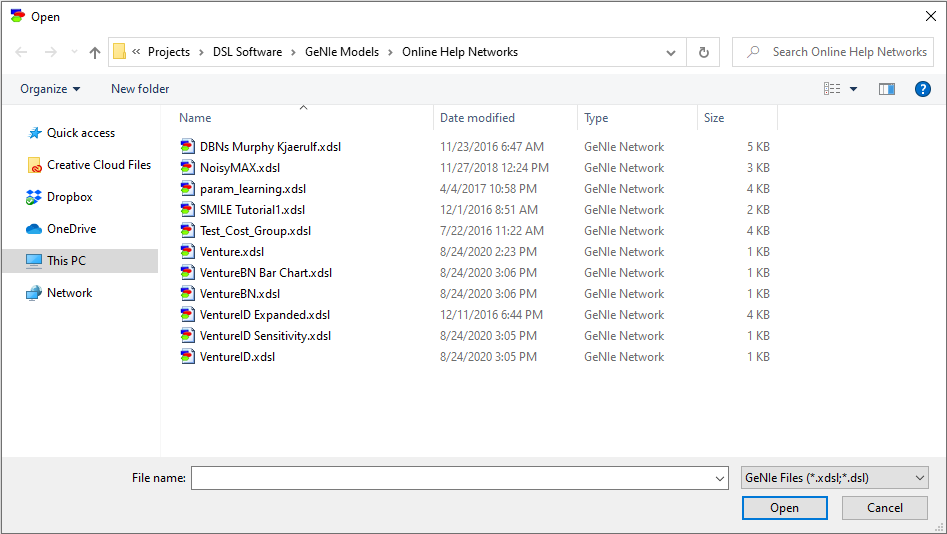
2. Click on Example Networks directory.
3. Select VentureBN.xdsl from the list and click on Open.
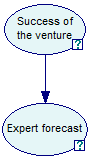
You should have the following network loaded in Graph View:
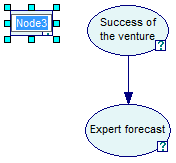
B. We will create a decision node and define its states. Start by selecting the Decision (![]() ) tool from the Tools Menu or the Standard Toolbar and click on some empty space near the network.
) tool from the Tools Menu or the Standard Toolbar and click on some empty space near the network.
You can always move the new node around for a more pleasant and readable layout by clicking and dragging it on the screen. Your screen will look as follows
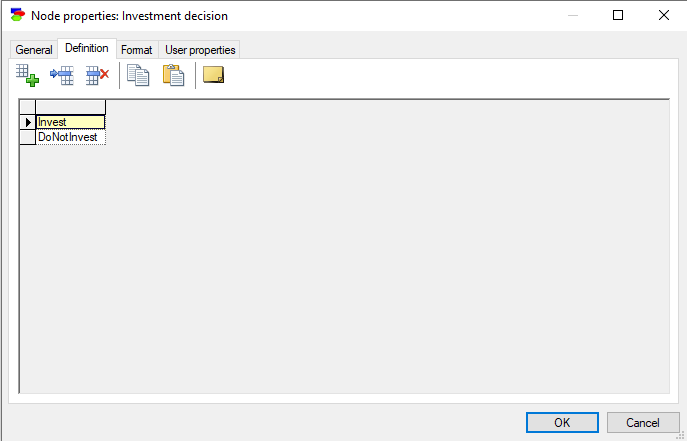
1. Double-click on the created rectangle to open its Node Properties sheet.
2. Change the Identifier of the new node to Invest and its Name to Investment decision.
3. Click on the Definition Tab and change the names of the decision options to Invest and DoNotInvest.
You will obtain the following:
4. Click OK to return to Graph View.
C. We need to create a value node to represent the utility values for each decision and link it to the diagram.
1. Select the Value (![]() ) tool from the Tools Menu or the Standard Toolbar and click on some other empty space near the network.
) tool from the Tools Menu or the Standard Toolbar and click on some other empty space near the network.
2. Double click on the node, change its identifier to Gain and its name to Financial gain and click OK.
You should obtain the following:
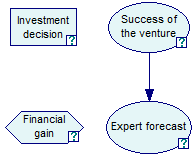
We need to tie the two new nodes (nodes Investment decision and Financial gain) with the original Bayesian network (nodes Success of the venture and Expert forecast) using arcs.
The financial gain from the investment depends clearly on whether the investment is made or not and on whether the investment will succeed. We reflect this by adding arcs.
3. Draw an arc from node Invest to node Gain and from node Success to node Gain.
The resulting influence diagram should look as follows:
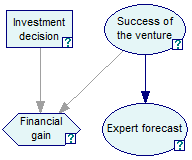
In as much as presence of an arc between two nodes denotes a direct dependence between them, absence of an arc represents independence. And so, the investment decision in this model has no impact on the success or failure of the venture. The only impact that the expert forecast has on the financial gain is indirect, by changing our belief in the success of the venture.
D. Now we are ready to enter the definition of the value node Gain.
1. Open the Node properties sheet for Financial gain by double clicking on the node
2. Click on the Definition tab, and enter the different values of gains, as shown below
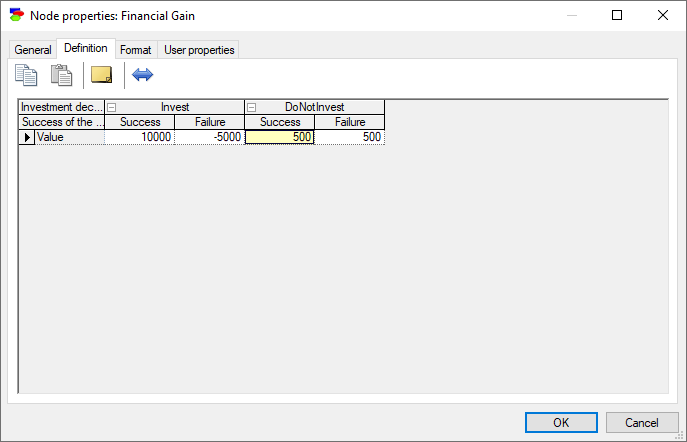
Please note that Financial gain is indexed by both Investment decision and Success of the venture: we have specified the monetary gain for each possible combination of their values. For example, if the capitalist decides to invest (outcome Invest) and the venture ends up in a success (outcome Success), the gain is $10,000.
E. We are now ready to solve the diagram, i.e., to determine which of the decision options (Invest or DoNotInvest) leads to the highest expected gain. Similarly to reasoning in Bayesian networks, we will use the Update tool.
Click on the Update (![]() ) tool from the Standard Toolbar.
) tool from the Standard Toolbar.
This solves the influence diagram.
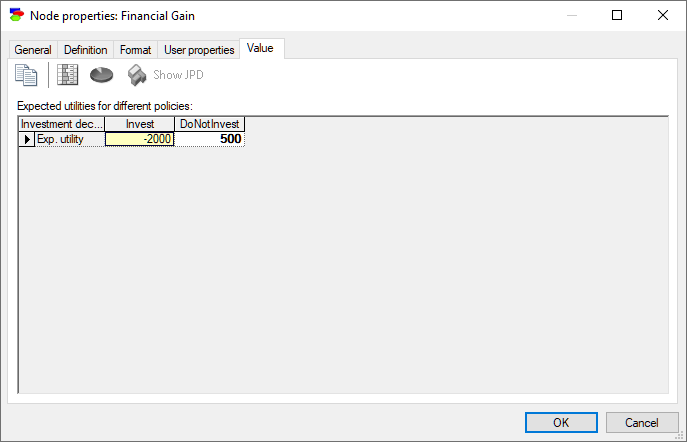
You can examine the solution by double-clicking on either the decision node (Investment decision) or the value node (Financial gain) and choosing the Value tab.
There is a difference in what you will see in terms of the result in each of these, but this difference materializes only in influence diagrams containing multiple decision nodes.
In our diagram, the decision node shows the result as follows:
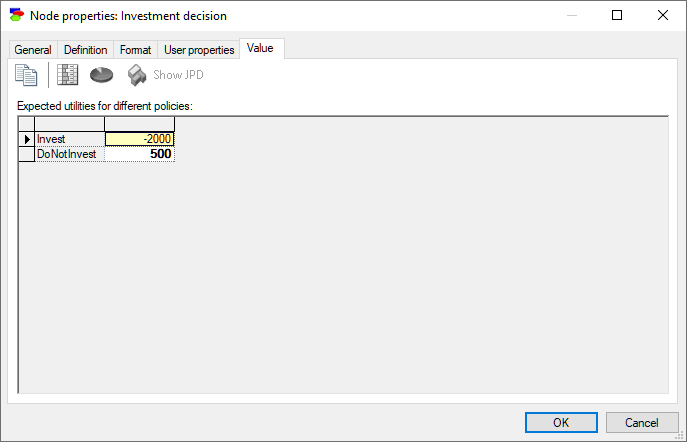
This result states essentially that the expected value of investment is a loss of $2,000, while the expected value of not investing is a gain of $500. If expected financial gain is the only investment criterion, our venture capitalist should not invest. The value node shows essentially the same result.
GeNIe offers two algorithms for solving influence diagrams: Policy Evaluation (default) and Find Best Policy, both listed in the Network Menu.
To choose an algorithm, click on the appropriate option in the Network Menu. GeNIe displays a bullet beside the currently active algorithm.
The Policy Evaluation algorithm solves the entire model, exploring all possible combinations of decision nodes and observations. For each of these combinations, it also calculates the posterior distributions of all those nodes in the network that are impacted by them. All this information may be not necessary for some applications, for example all those in which it is enough to identify the best decision option for the next decision step. If the focus of reasoning is finding the best decision option rather than computing the expected values (or expected utilities) of a set of decision options, we suggest that you select the Find Best Policy algorithm. The algorithm calculates this best choice much faster than when evaluating all policies. To use this algorithm, set the default influence diagram algorithm to Find Best Policy and update beliefs. The algorithm will only calculate the best choice for the first undecided decision node. Once the network is updated, the best choice for the first undecided decision node will be the one containing a "1" in the node value. The remaining choices will contain 0s. The algorithm is applicable only to those influence diagrams, whose first undecided decision node has no undecided/unobserved parents.
You can find the above model among the example models under the name VentureID.xdsl included in the distribution version of GeNIe.
Be careful while saving the model that you have just worked on, because if you choose the Save option, then the VentureBN model will be overwritten. If you want to save the model that you have just created, choose Save As option from the File Menu.