Sensitivity analysis (Castillo et al., 1997) is technique that can help validate the probability parameters of a Bayesian network. This is done by investigating the effect of small changes in the model's numerical parameters (i.e., prior and conditional probabilities) on the output parameters (e.g., posterior probabilities). Highly sensitive parameters affect the reasoning results more significantly. Identifying them allows for a directed allocation of effort in order to obtain accurate results of a Bayesian network model.
GeNIe implements an algorithm proposed by Kjaerulff and van der Gaag (2000) that performs simple sensitivity analysis in Bayesian networks. Roughly speaking, given a set of target nodes, the algorithm calculates efficiently a complete set of derivatives of the posterior probability distributions over the target nodes over each of the numerical parameters of the Bayesian network. These derivatives give an indication of importance of precision of network numerical parameters for calculating the posterior probabilities of the targets. If the derivative is large for a parameter p, then a small change in p may lead to a large change in the posteriors of the targets. If the derivative is small, then even large changes in the parameter make little difference in the posteriors.
To invoke sensitivity analysis in a Bayesian network, choose Sensitivity Analysis from the Network Menu
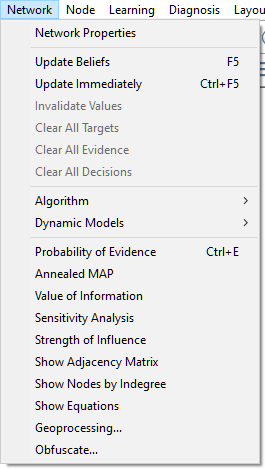
or press the Sensitivity analysis (![]() ) tool on the Standard Toolbar. This leads to changing the coloring of the network to indicate where the sensitive parameters are located. Please note that the sensitivity analysis algorithm cannot be invoked unless there is at least one node that has been designated as a Target.
) tool on the Standard Toolbar. This leads to changing the coloring of the network to indicate where the sensitive parameters are located. Please note that the sensitivity analysis algorithm cannot be invoked unless there is at least one node that has been designated as a Target.
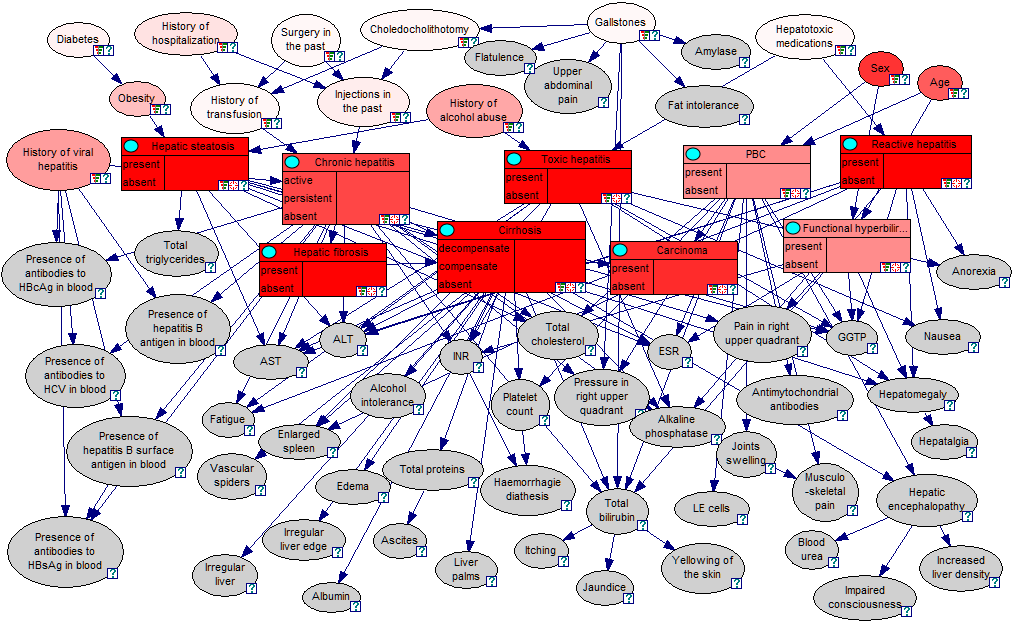
Nodes colored in red contain parameters that are important for the calculation of the posterior probability distributions in those nodes that are marked as targets (in the screen shot above, the rectangular nodes represent various liver disorders and have been marked as targets). Gray-colored nodes do not contain any parameters that are used in the calculation of the posterior probability distributions over the target variables. Sensitivity of any of these parameters is zero and is determined qualitatively, before any computation takes place, based on GeNIe relevance computation layer. It is important to understand that the sensitivity analysis algorithm gives results that are context dependent - the value of derivatives calculated depend on the current target set and the set of observations made in the network. You may perform further observations and clear existing observation, which will prompt the algorithm to recalculate the derivatives and to recolor the graph.
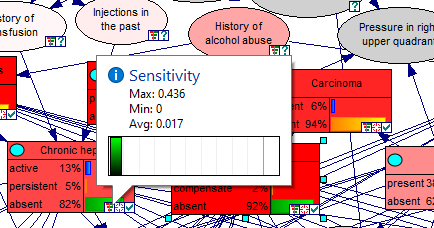
Hovering over the tornado icon in individual nodes shows summary information for those nodes
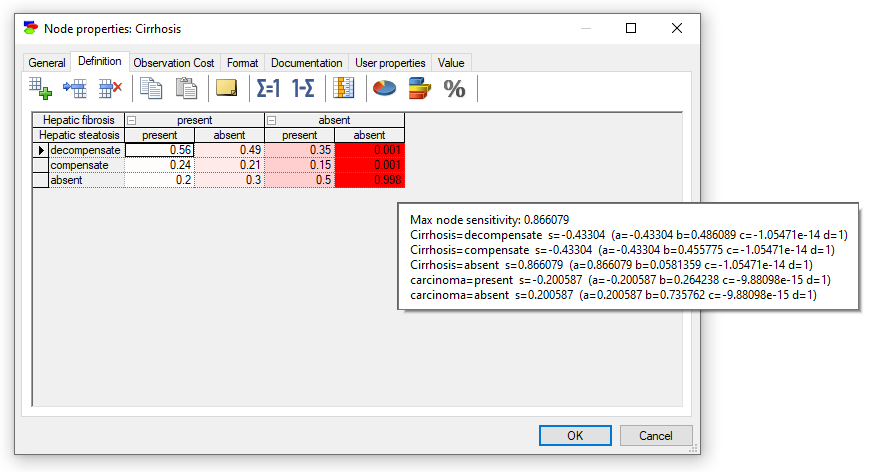
Double-clicking on the node Cirrhosis (one of the nodes in red) shows the following view of the definition tab
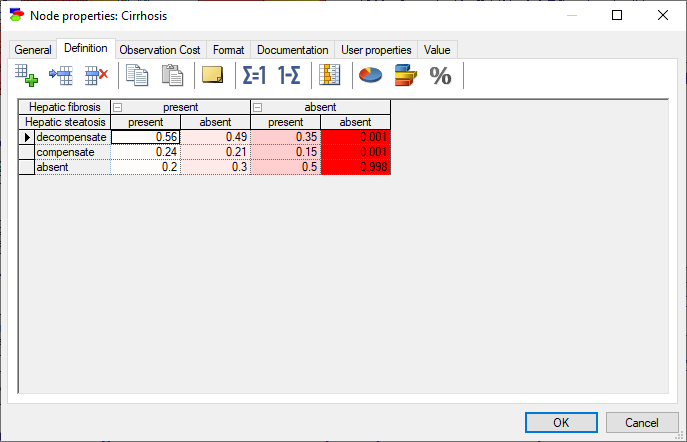
The coloring of the individual elements of the definition shows those individual parameters that are important. Hovering over them shows additional information from which we can read the numerical values of the computed derivatives
Double-clicking on the small Tornado (![]() ) icon in any target node opens the Tornado Diagram dialog. The following screen shot shows the dialog box that opens after clicking on the tornado icon on the node Cirrhosis
) icon in any target node opens the Tornado Diagram dialog. The following screen shot shows the dialog box that opens after clicking on the tornado icon on the node Cirrhosis
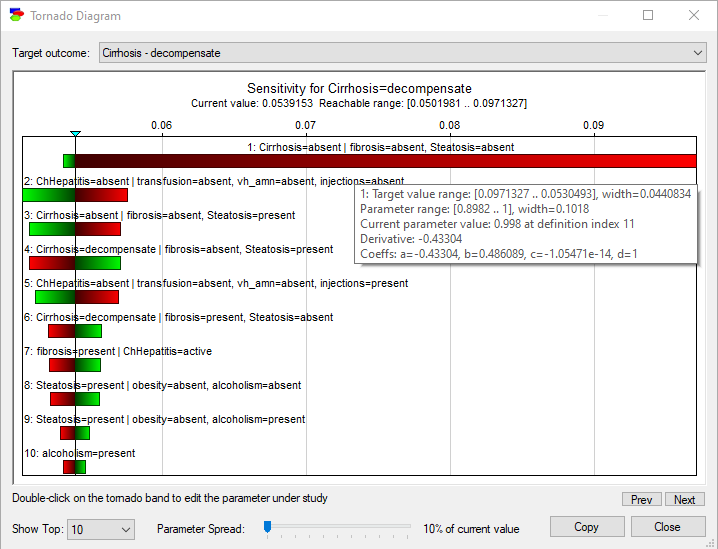
The diagram shows the most sensitive parameters for a selected state of the target node (in this case, decompensate state of the node Cirrhosis) sorted from the most to least sensitive. For each parameter, we see its precise location in the model (node and its state conditional on the parents and their states). The bar shows the range of changes in the target state as the parameter changes in its range (in this case 10% of its current value up and 10% down). The color of the bar shows the direction of the change in the target state, red expresses negative and green positive change.
The diagram can be copied (by pressing the Copy button or right-clicking and selecting Copy) and pasted into another application. Please keep in mind that GeNIe copies the information related to the diagram and it is your responsibility to paste it in the format that you require. The default paste depends on the destination application and this may depend on the application's preferences as set by the user. If you wish to control the paste format, we advise to use Paste Special, which allows you to choose a picture or a text describing the sensitivity.
The tornado diagram plot can be customized. We can select the number of parameters shown in the graph between Top 10 (the default) and All. The slider on the bottom of the dialog (Parameter Spread) allows us to vary the percentage of change in all parameters (the default is 10%). Clicking on the Copy button or right-clicking on the tornado diagram and choosing Copy copies the entire diagram to the clipboard for a later Paste into other programs, such as Microsoft Word or PowerPoint in bitmap or picture format, explained in the Graph view section. The horizontal axis shows the absolute change in the posterior probability of Cirrhosis=decompensate when each of the parameters changes by that percentage.
Hovering over any of the bars shows the exact numerical sensitivities for that bar. In the screen shot above, the gray rectangle shows the parameters for the first bar from the top (Cirrhosis=absent|fibrosis=absent, Steatosis=absent). Here is a brief explanation of the displayed parameters.
Target value range shows the minimum and maximum posterior probability values for the selected Target outcome (in the screen shot above, it is the state decompensate of the target node Cirrhosis). These minimum and maximum posterior probability values depend directly on the Parameter Spread selected.
Parameter range show the minimum and maximum parameter value. Again, these depend directly on the Parameter Spread.
Current parameter value shows the nominal value of the probability in the CPT of the node in question. The probability is identifiable uniquely by the states of the conditioning variables (in this case, fibrosis=absent, Steatosis=absent).
Derivative is the value of the first derivative of the posterior probability T of the selected state of the target node (at its current value) over the parameter p in question. The posterior probability is represented by the following general general linear rational functional form:
T=(a * p + b) / (c * p + d) .
The sensitivity analysis algorithm calculates the four coefficients (a, b, c, and d). Once we know these, it is trivial to obtain the derivative (which is the basic measure of sensitivity) and target posterior range (see above). Coeffs lists the calculated values of a, b, c, and d. The formula for the derivative is:
D=(a*d - b*c) / (c * p + d)2 .
The denominator is positive, therefore the sign of the derivative is constant for all values of p and, hence, the function is either monotonic or constant. By substituting 0 and 1 for p in the first formula (note that p is a probability), we can calculate how much the posterior will change if p is modified in its entire range. The range is defined by:
p1=b/d
p2=(a+b)/(c+d)
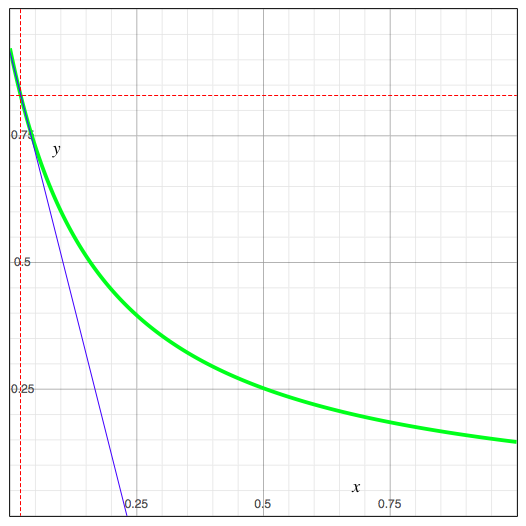
The sign of a*d-b*c determines which value (of p1 and p2) is the minimum and which is the maximum. The following example figure shows a visualization of how the sensitivity is calculated and what it means. x in the plot stands for p, the value of the parameter under study, y stands for T, the posterior probability of the selected state of the target node. The green plot shows this posterior probability as a function of the value of the parameter under study, the blue line, tangent to the green line at the current value of the two parameters, illustrates the derivative.
Sensitivity analysis can be also performed in influence diagrams. It is implemented in such as way that GeNIe executes multiple sensitivity analyses, one for each combination of the indexing parents for the terminal utility node, which is by definition the target. There is no need to set it to be a target (in fact, it is impossible to set it to be a target) - it is a target by default. The captions over the tornado bars help in identifying the scenario.
Sensitivity analysis is essentially an art with few standard procedures. Refining a model involves a search for the most important parameters and paying attention to their precision. The sensitivity analysis, as implemented in GeNIe, is a good first step in this process.