Once a model is evaluated, you are ready to view the results computed by GeNIe. This can be done in several ways. Viewing the results of probabilistic inference, captured in chance nodes of the underlying Bayesian networks, has been described in section Viewing results in the section on Bayesian networks.
Posterior probability distribution in influence diagrams are more detailed. In cases when a node's probability distribution is affected by a decision or by a node that precedes a decision node, the posterior probability distribution is indexed by the outcomes of these nodes. In such cases, right clicking on a node icon will display a message The result is a multidimensional table, double click on the icon to examine it.
The only way to see the entire distribution, is by using the Value tab of the decision node or the value node in question. Shown below is the value node for the influence diagram example from the section:
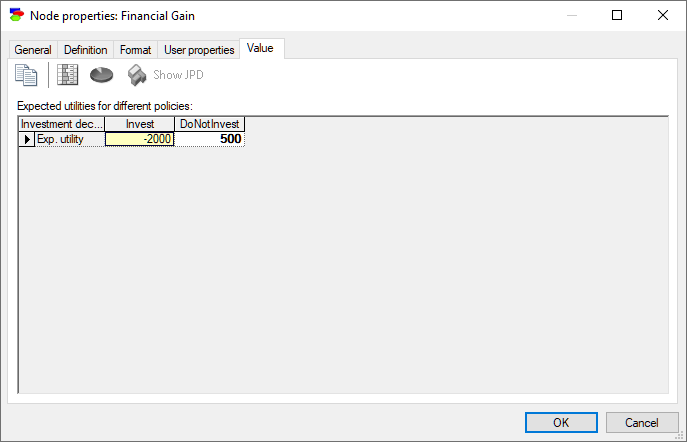
There is a difference in what you will see in terms of the result in each of these, although this difference materializes only in those influence diagrams that contain multiple decision nodes. The value node will show the expected utilities of all combinations of decision alternatives. The decision node will show the expected utilities of its alternatives, possibly indexed by those decision nodes that precede it. In case decision nodes have predecessors, these predecessors will index the result if they have not been observed before making the decision.