GeNIe supports simple sensitivity analysis in graphical models. To perform sensitivity analysis, add an additional indexing variable that will index various values of parameters in question and have GeNIe compute the impact of these values on the results. We will demonstrate this idea on the example diagram introduced in the Building an influence diagram section. If you do not have it saved, you can find a copy in the Example Networks folder (it is named VentureID.xdsl).
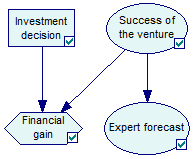
You should have the following network loaded in the Graph View:
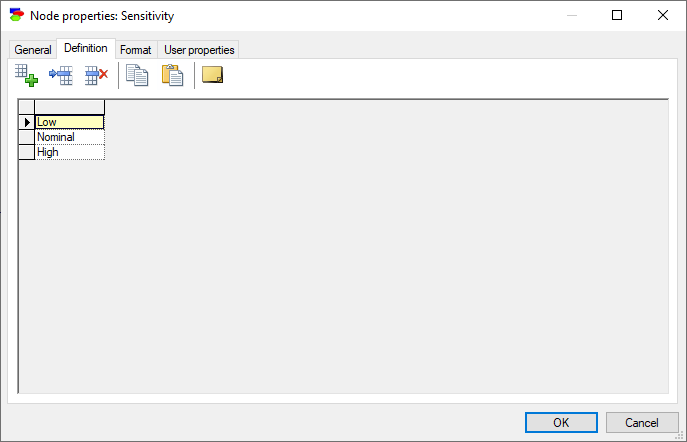
Suppose that we are uncertain as to the actual probability of the success of the venture. Believing that the nominal value of 0.2 is approximately right, we feel that it can be as low as 0.1 and as high as 0.35. To express this, we will add a Decision node called Sensitivity with three states: Low, Nominal and High.
Create a Decision node by selecting the Decision (![]() ) tool from the Tools Menu or the Standard Toolbar and click on some empty space near the network. Name the newly created node Sensitivity, define three states for the node, and name them Low, Nominal and High.
) tool from the Tools Menu or the Standard Toolbar and click on some empty space near the network. Name the newly created node Sensitivity, define three states for the node, and name them Low, Nominal and High.
We will use this newly created decision node (Sensitivity) to index the Success of the venture node and, by this, define a range of values of probability of success. To this effect, we need to add a directed arc from Sensitivity to Success of the venture. We may add an arc from Sensitivity node to Investment decision node in order to introduce an explicit temporal order between the two decision nodes. It will be an information arc and it will be dashed. An arc between two decision nodes practically signifies temporal order between the nodes. The model, included among the example networks as VentureIDSensitivity.xdsl, will take the following form:
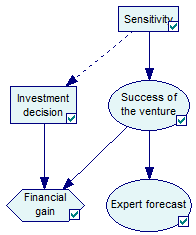
If you forget to add the arc between Sensitivity and Investment decision, do not worry, because GeNIe will automatically assume the temporal order between the two and draw an arc for you between Sensitivity and Investment decision.
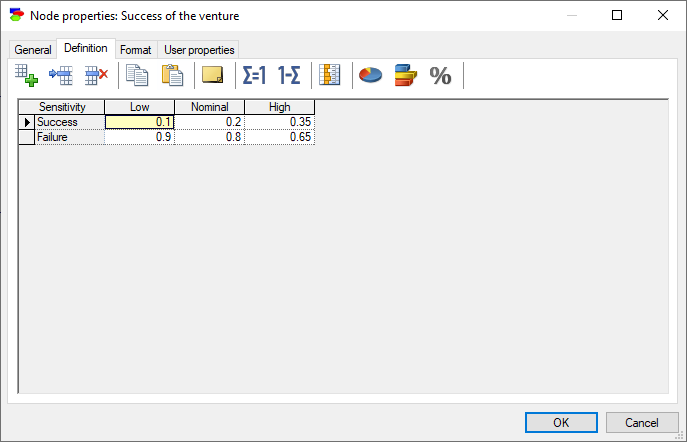
The states of the node Sensitivity will index the parameters of Success of the venture and will allow to specify their low, nominal, and high values. We enter the low, nominal, and high values for the probability of outcome Success in the conditional probability table of the node Success. The table should look as follows:
Now we are ready to update the model and observe the results. Update the model (e.g., by pressing the Update ![]() icon on the Standard Toolbar) and open the Value tab of Node Properties Sheet of the Investment decision node. You should see the following:
icon on the Standard Toolbar) and open the Value tab of Node Properties Sheet of the Investment decision node. You should see the following:
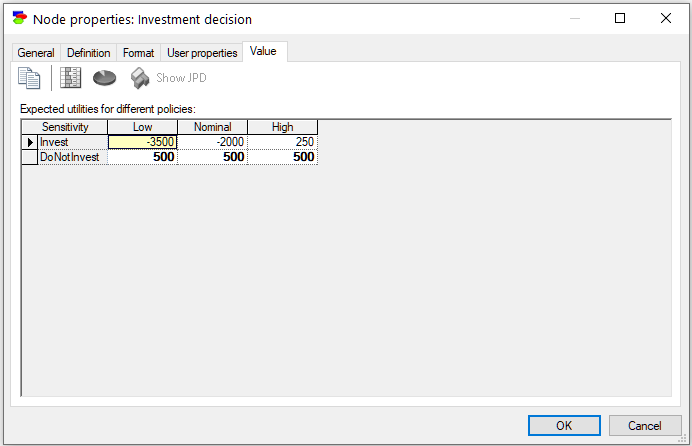
We can see that even the most optimistic value of the probability of success still does not make Invest an attractive option, so our decision is not sensitive to the value of the probability of success.
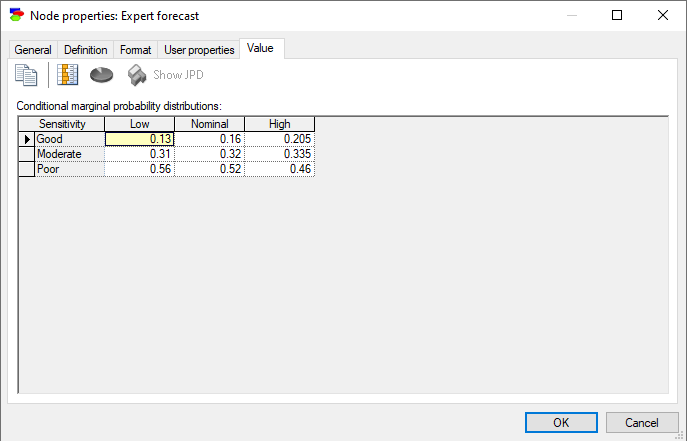
We can also observe the impact of uncertainty over the probability of success on the posterior probability distribution of any node in the network. In the example above, we can examine the posterior probability of the node Expert forecast and see its marginal probability distribution as a function of our initial estimates of the probability of success:
The modified influence diagram for sensitivity analysis is saved as VentureID_Sensitivity.xdsl in the Example Networks folder.
There is an alternative algorithm for sensitivity analysis that you may want to choose. It is described in the section Sensitivity analysis in Bayesian networks. This algorithm can be executed for influence diagrams as well, in which case, the utility node (in case of a complex structure of utility nodes involving MAU and/or ALU nodes, the terminal MAU/ALU node) is by default the target node. There is no need to set this node to be the target - GeNIe sets it to be the target by default. In influence diagrams, GeNIe runs multiple sensitivity analysis, one for each combination of the indexing parents for the terminal utility node. Interpretation of the results is described in the Sensitivity analysis in Bayesian networks section. Captions over the tornado bars should help in identifying the individual scenario (combinations of values of the indexing nodes).