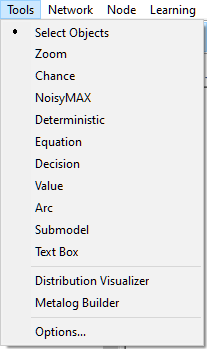
To change program options, select Options... from the Tools Menu
The following dialog appears
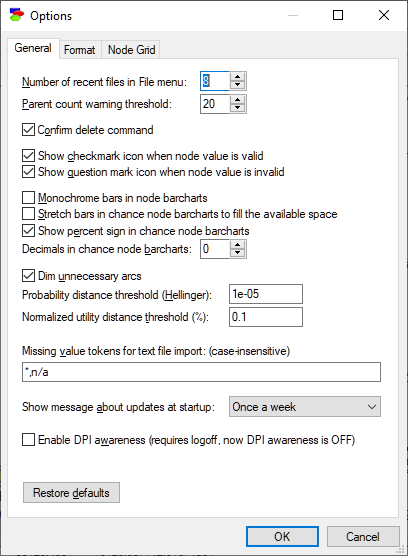
General tab
Number of recent files in File Menu determines the number of file names and locations in the File Menu saved between sessions.
Parent count warning threshold is an important practical setting, especially for beginning modelers. As you increase the number of parents of a node, the node's CPT grows exponentially. With 10 binary parents, the CPT contains 1,024 columns, with 20 binary parents, this number is 1,048,576. As the number of parents grows, at some point, this will exhaust all available computer memory. This setting determines when a model author should be given a warning that the number of parents is getting out of hands.
Confirm delete command, when set, issues a warning when the user issues a Delete command.
Show checkmark icon when node value is valid and Show question mark icon when node value is invalid control two important node status icons.
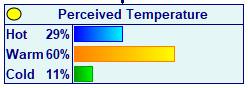
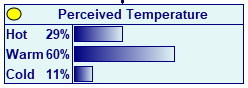
Monochrome bars in node barcharts changes the colorful bars displaying the probabilities of various outcomes into monochrome bars. Some users find it more natural, especially given that GeNIe chooses the colors automatically and the colors of bars in a node are not related in any way to the same colors in other nodes. Compare the following two: color bars (left) and monochrome bars (right):
Stretch bars in chance nodes barcharts to fill the available space controls the appearance of the node bar chart view.
Show percent signs in chance node barcharts and Decimals in chance node barcharts control the display of numerical posterior probabilities in the node bar chart view.
Dim unnecessary arcs is an important modeling tool. When the probability distributions in a CPT are such that a parent's state makes no difference, the arc between the parent and the node is not necessary. This is often the case when building a model - because GeNIe makes sure that a model is always syntactically correct, it puts uniform distributions in all columns of the node's CPTs. Whenever an arc is added, distributions are copied and are identical for all states of the parent node. Because unnecessary arcs are dimmed, it is clearly visible which arcs still need modeling attention. Without this cue, it is easy to overlook node definitions. Indeed, when we converted some sizeable Bayesian network models to GeNIe format, we typically noticed several dimmed arcs, which means that the modelers have overseen them when eliciting parameters. Real numbers are rarely identical, so the Probability distance threshold (Hellinger) is a setting that allows for approximate equality of distributions. When two distributions are equal up to the threshold, they are considered equal. Utilities are not distributions, so when they are compared, the second setting (Normalized utility distance threshold (%)) is used. When two utilities differ less than the indicated percentage, they are considered equal.
Missing value tokens for text file import: (case-insensitive) (default value "*,n/a") allows for specifying the text that will be recognized in input files as denoting missing values.
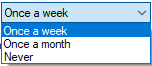
Show message about updates at startup controls the frequency with which GeNIe informs its users about availability of updates. Information about updates appears always in the About GeNIe dialog but also as a message in the Output window, which is what this option controls. Frequency of messages can be set to one of three: Once a week, Once a month, and Never.
Windows allows for changing the size of text in its Display Preferences panel. The size is set to its default "100%" value unless you have high DPI (dots per inch) display. With the value greater than 100% set in Windows, you can change GeNIe's appearance, as shown in the screen shots below, using the Enable DPI awareness option.
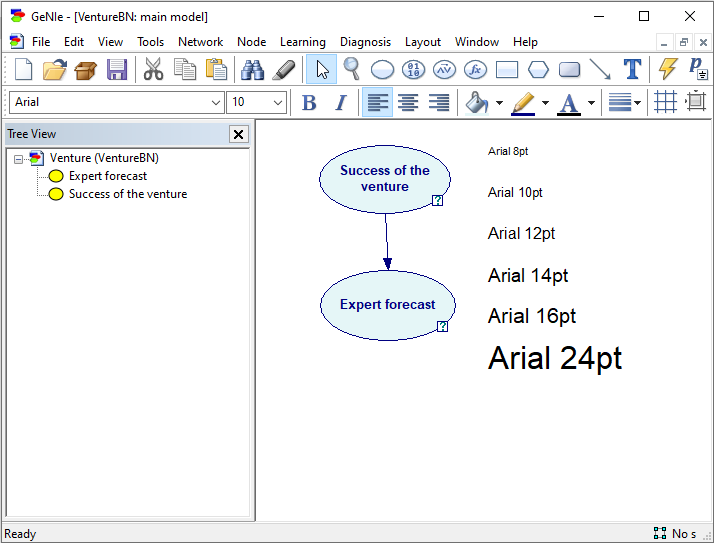
To get an idea of the impact of this option on the display, please look at the following model with Windows 10 at 150% scaling, with Enable DPI awareness OFF:
and with Enable DPI awareness ON:
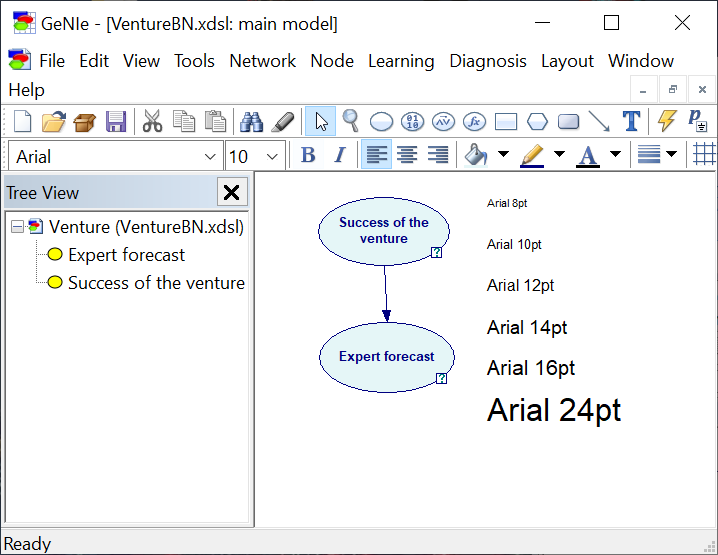
Clearly, perceived font size and clarity differ. Please note that relative size of the fonts in GeNIe's Graph View are unaffected. We leave it up to the user whether to set this option or not. Our preference is for keeping this option OFF.
Please note that GeNIe's graphical network view always assumes 96 DPI. Also note that our experience with Windows 10 indicates that changing Enable DPI awareness option and restarting the program does not always have the desired effect, hence we recommend logging off the current Windows session before checking the effect of Enable DPI Awareness on GeNIe.
Format tab
The Format tab allows for setting the default format for objects in the Graph View. The format can be changed later but here is where we set the initial values.
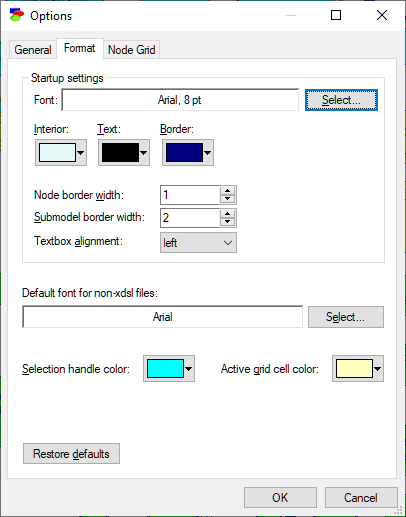
The top part of the Format tab concerns nodes, submodels, and text boxes. Model elements in most of the screen shots in this document use the default settings pictured in the above Format dialog.
XDSL files contain font specifications. Default font for non-xdsl files is for all those file formats that do not specify the font explicitly.
Selection handle color determines the color of node handles when nodes are selected, like the eight handles around the Chance node below.

Active grid cell color is the color or a CPT cell that is active, i.e., that is selected by the cursor, like the cell for the state Success below.
![]()
Node Grid tab
The Node Grid tab contains the settings of the CPT grid in the node Definition tab.
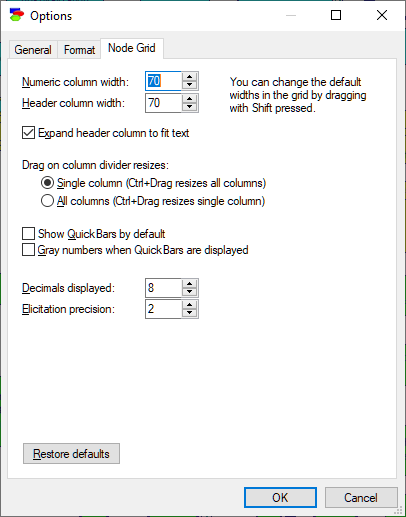
Most of the settings control the physical appearance of the node Definition grid and are self-explanatory.
Decimals displayed (default 6) control precision of numerical probabilities in the CPTs.
Elicitation precision (default 2) controls the precision of graphical methods of probability elicitation (pie chart and bar chart).
Diagnosis tab
The Diagnosis tab allows for choosing three default program parameters:
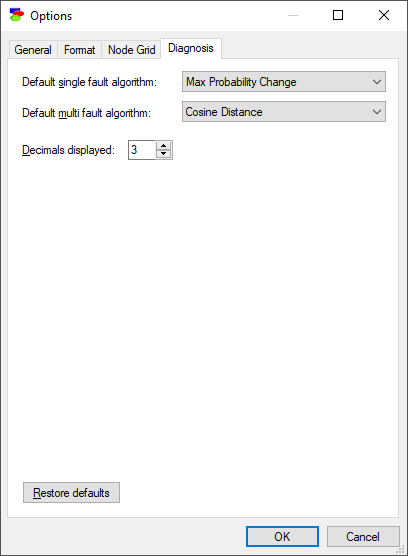
Default single fault algorithm for diagnostic value of information computation.
Default multi fault algorithm for diagnostic value of information computation.
Decimals displayed when displaying the marginal probability of faults and also diagnostic values.