We review in this section two important aspects of viewing nodes in the Graph View.
Icons and bar charts
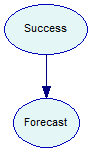
There are two ways of viewing a node in the Graph View, as an icon
![]()
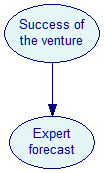
and as a bar chart, which displays graphically the node's marginal probability distribution
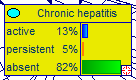
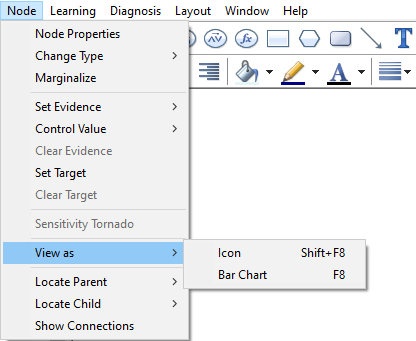
The advantage of seeing a node as a bar chart is that we can see at any point in time its marginal probability distribution. The disadvantage is that a bar chart takes more space on the screen and may unnecessarily draw user's attention. We advise that those nodes, whose marginal probability distributions are of interest, are viewed as bar charts. To switch between the two view, select the nodes in question and select the view on the Node Menu:
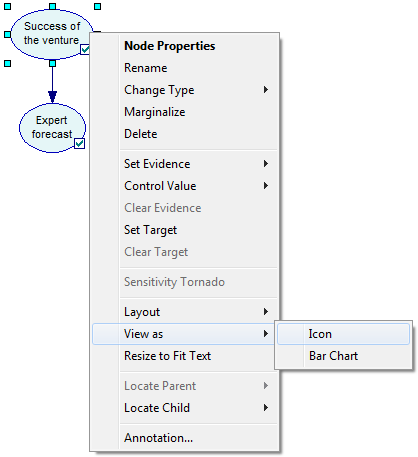
The same can be accomplished by means of the Node Pop-up menu:
In order to apply the Icon or Bar Chart view to all nodes in the model, please invoke the View as choice from the Network pop-up menu when no nodes are selected.
Names and identifiers
There is another important element of viewing nodes: Viewing their IDs or their names. IDs are short and play the role of variable names. GeNIe uses them for the purpose of compatibility with equation-based variables, where reference to other nodes in a node's definition has to be through a unique identifier. Identifiers have to start with a letter followed by any combination of letters, digits, and underscore characters. Letters are a-z and A-Z but also all Unicode characters above codepoint 127, which allows using characters from other alphabets than the Latin alphabet. Names are longer and have no limitations on the characters that they are composed of. A model viewed with identifiers looks cryptic.
A model viewed with names is more digestible to human users.
To switch between IDs and names, please use the View Menu
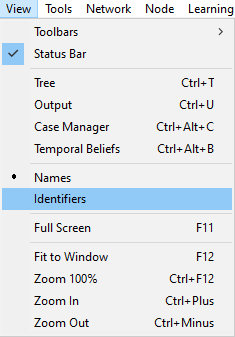
You can also toggle between IDs and names by pressing F9.
We advise that, unless there are important reasons for viewing them as identifiers, nodes be viewed by names. This is more readable for human users.