Observing the value of a variable is often associated with cost. For example, in order to observe the platelet count, one has to draw a blood sample and subject it to examination by professionals. Measuring the temperature of an air conditioner exhaust unit requires a technician's time. In order to perform an optimal diagnosis, one has to take into account the value of information along with the cost of obtaining it. GeNIe allows for entering the cost of observing the value of a variable.
Simple costs
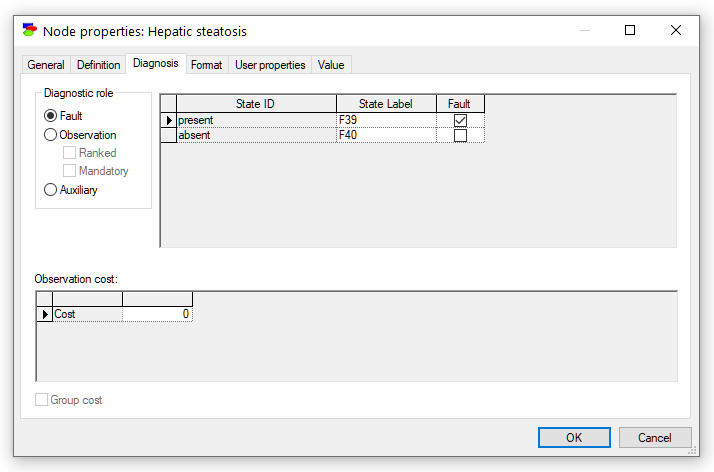
Simple cost is used when the cost of observing a node is independent of whether other nodes are observed or not. Simple cost could be the cost of performing a diagnostic test. This cost is set in the Diagnosis tab in Node Properties dialog:
Simple costs can be also entered in the Spreadsheet View:
Conditional costs
Sometimes, costs of observing a variable are not independent of observing other variables. For example, once a blood sample is taken, performing additional tests on it is cheaper than performing these tests when no blood sample is available. The cost of measuring some parameter of a locomotive engine depends on whether the locomotive is in the shop or in the field. It may be much lower when the locomotive is in the shop. Taking off a locomotive cover may take a few hours but once it is removed, many tests become inexpensive. GeNIe represents conditional costs by means of an acyclic directed graph, available in the Cost Graph View.
The Cost Graph View is a modified version of the Graph View that shows the cost dependencies between the nodes of the network. The snapshot below is of the Cost Graph View.
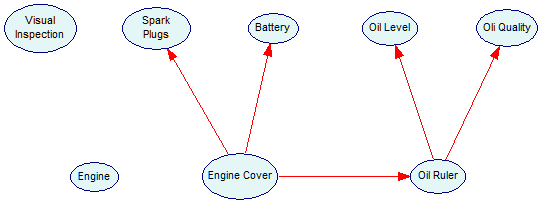
The Cost Graph View can be invoked by choosing the Show Cost Arcs switch from the Diagnosis menu. You can return to Graph View by choosing the Show Cost Arcs switch from the Diagnosis menu again.
The following changes will occur when the Cost Graph View is invoked:
1. All arcs of your graphical model (dark navy colored by default) will disappear and only the cost arcs (red colored by default) will appear between the nodes. If the cost arcs are not visible, then probably none are yet defined (this is the initial state for any model).
2. The arc (![]() ) button changes into a cost arc button (
) button changes into a cost arc button (![]() ).
).
3. The Arc menu item in the Tools Menu changes to Cost Arc.
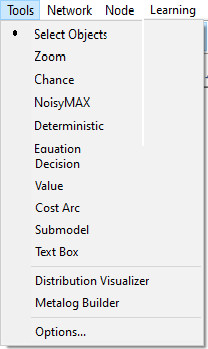
You can select the Cost Arc tool from either the Tools Menu or by clicking on the Cost arc button from the Standard Toolbar and add cost dependencies between nodes just as you add normal dependencies between nodes.
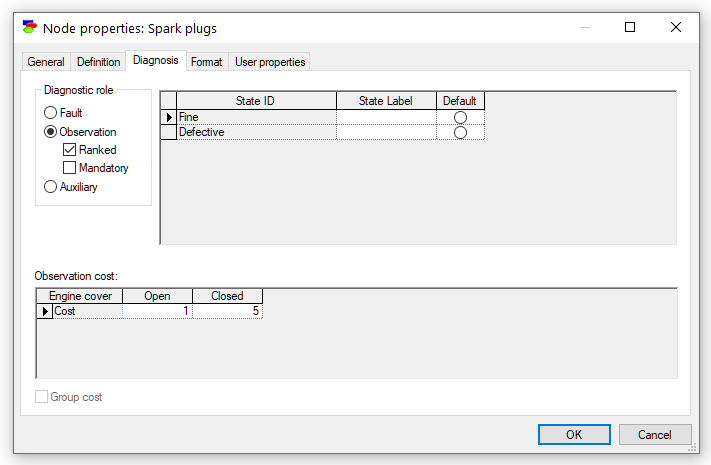
Once we have added a cost arc from the node Engine cover to the node Spark plugs, the cost tab shows two costs, one for when the engine cover is Open and one for when the engine cover is Closed.
Group costs
Group cost is used when the cost of observing a variable incurs a constant preparatory cost in addition to the cost of observing the variable. A typical example of a group cost is taking a blood sample, in which the cost of the blood sedimentation rate test incurs the cost of first drawing a blood sample from a patient. Another example is performing a test of an internal part of a locomotive engine, which involves removing the engine cover of a locomotive to access engine parts. Once a blood sample is drawn or the locomotive cover is open, any other tests will incur only simple costs. A group of nodes with a common group cost can be defined in the Node properties window. Group cost is one time cost associated with performing the first test of a particular group. The group cost node also designates the cost group.
To add a group cost to a node, the user must check the Group cost check box
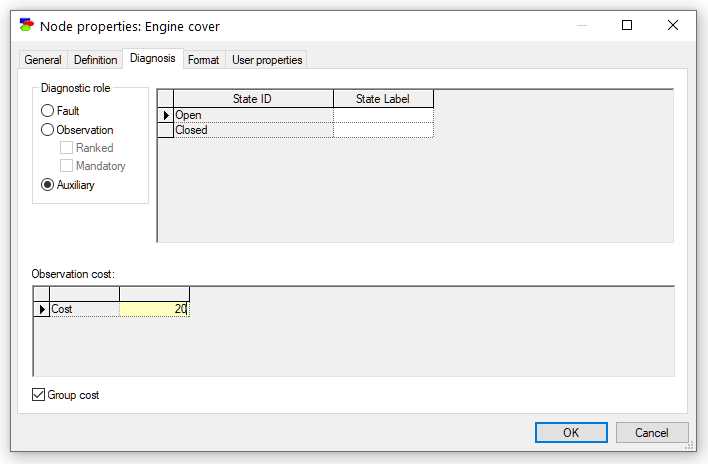
The Group cost check box is enabled only if the current node has more than one child.
Subsequently, go to the User Properties tab and Add a property named, for example, DIAG_TESTGROUPCOST
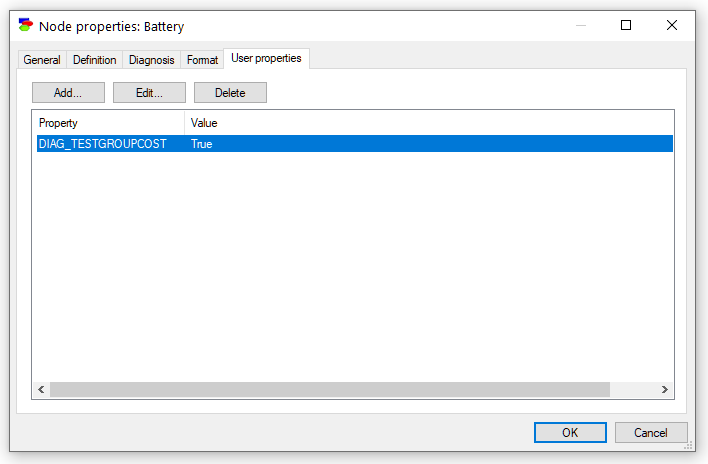
The nodes that have the DIAG_TESTGROUPCOST property defined will incur the cost associated with opening the Engine Cover. As mentioned, this cost will only be applied to the nodes as long as none of the nodes of that group have been instantiated. Assume that the group cost of opening the Engine Cover is set to 20 units. In the example, the cost of observing the state of Spark Plugs is set at 2 units and the cost of checking the Battery is set at 5 units. As long as neither of the nodes is observed, the total cost of checking Spark Plugs is 22 units and the cost of checking Battery is 25 units. If either node, Spark Plugs or Battery, is set to a state, then the group cost will be set to 0 units. For example, if Battery is set to Good, the cost of performing the Spark Plugs test will now be 2 units. The 20 unit cost associated with the node Engine Cover no longer applies.