Diagnosis menu for a new model is mostly grayed out, except for the choice Enable Diagnosis, which turns on GeNIe's diagnostic extensions
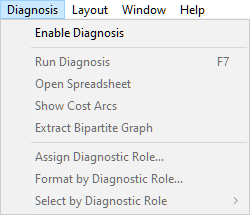
Diagnostic extensions are turned on or off for each open model individually. They are turned on automatically for those newly loaded models that have diagnostic information specified but are turned off for any other, including those newly created models. When diagnostic extensions are turned on, all other items on the Diagnosis menu are activated, the Run diagnosis (![]() ) button becomes active, and node property sheets are also extended with special diagnostic functionality.
) button becomes active, and node property sheets are also extended with special diagnostic functionality.
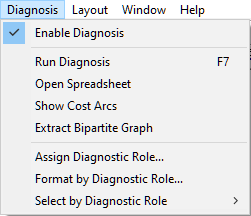
Run Diagnosis command (shortcut F7) opens the Diagnosis window, which allows for performing diagnosis interactively with the current model.
Open Spreadsheet command opens the Spreadsheet View for the current network in a separate window. The Spreadsheet View is a special extension of GeNIe that is useful in rapid building of diagnostic models - all properties of every variable of a model are listed in one window and the user specifying a model can move rapidly between variables and enter or modify their specifications.
Show Cost Arcs command toggles the Graph View to Cost Graph View. The Cost Graph View allows for specifying conditional costs of performing tests and making observations. See Cost of observation section for more information.
Extract Bipartite Graph command extracts from a diagnostic model a two layer network, in which nodes in the upper layer are composed of all Fault nodes, all nodes in the lower layer are Observation nodes, and there are arcs connecting Fault nodes with Observation nodes, i.e., there are no arcs between nodes in the same layer. No changes are made to the original model by this operation. Bipartite graphs are structurally simpler than general graphs, which often goes together with reduced computational complexity, and are of interest to some knowledge engineers building diagnostic models.
The Assign Diagnostic Role... dialog invokes a dialog that allows for setting diagnostic roles for groups of nodes.
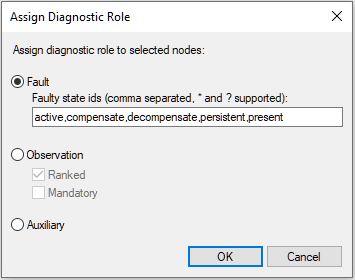
All nodes selected at the time that the dialog has been invoked will be assigned the selected diagnostic role. In case of Faults, one has to select those states of the nodes that represent faulty states. The small window right below the selection allows for specifying state IDs that denote faulty states. The window is pre-filled with state IDs that are currently designated as fault states and accepts wild card characters, such as * and ?, with role identical to the role that they play in most computer systems. In case of Observations, one can select whether they should be Ranked and/or Mandatory. The meaning of these two properties as well as the diagnostic roles in general are explained in the Diagnosis Window section.
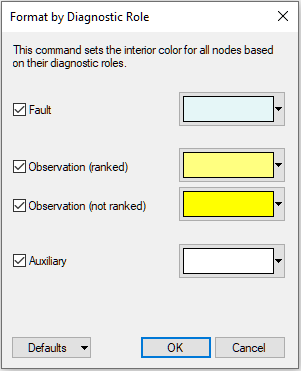
The Format by Diagnostic Role... option invokes a dialog that allows to specify coloring of nodes based on their diagnostic properties.
Clicking on the Defaults displays the following pop-up menu:
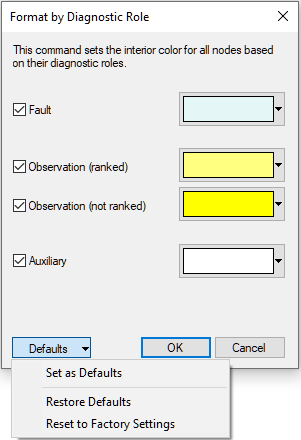
Set as Defaults sets the current selection of colors as the defaults colors for Format by Diagnostic Role.
Restore Defaults restores the color settings to the default settings.
Reset to Factory Settings restores the color settings to the factory settings that come with GeNIe.
Select by Diagnostic Role sub-menu allows for selecting all nodes belonging to one of the three types of diagnostic nodes: Faults, Observations, Ranked Observations, Mandatory Observations, or Auxiliary nodes.

The typical application of this selection is joint editing of each type of nodes, for example coloring or displaying as bar charts.