The Diagnosis Window is a special GeNIe module that supports diagnostic applications.
Composition of the Diagnosis Window
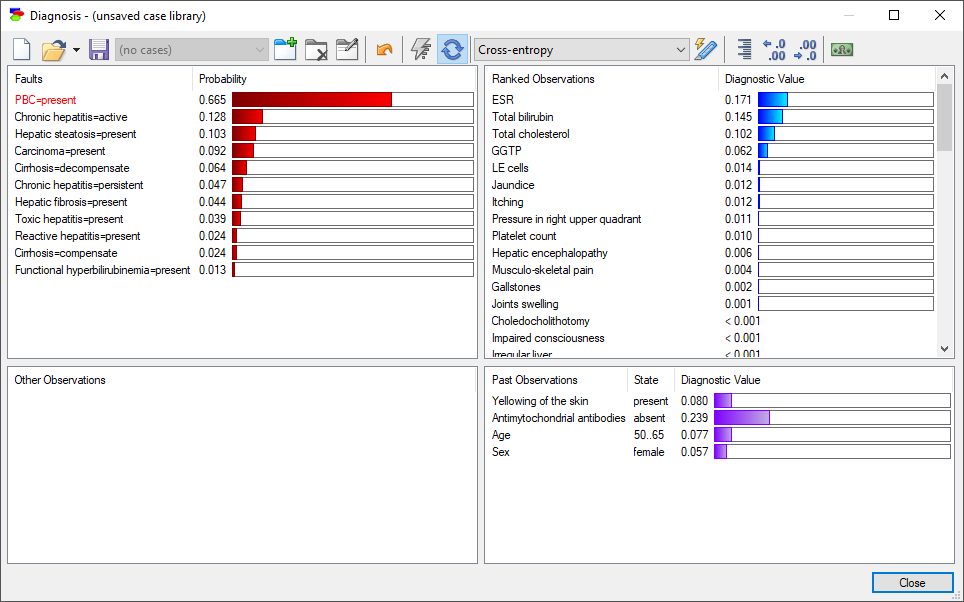
One of the example models with diagnostic extensions is the Hepar II model. Once the model has been loaded and diagnostic extensions enabled, please click on the Run diagnosis (![]() ) button on the toolbar, or press F7. Once the Diagnosis window has opened, it will appear as shown below:
) button on the toolbar, or press F7. Once the Diagnosis window has opened, it will appear as shown below:
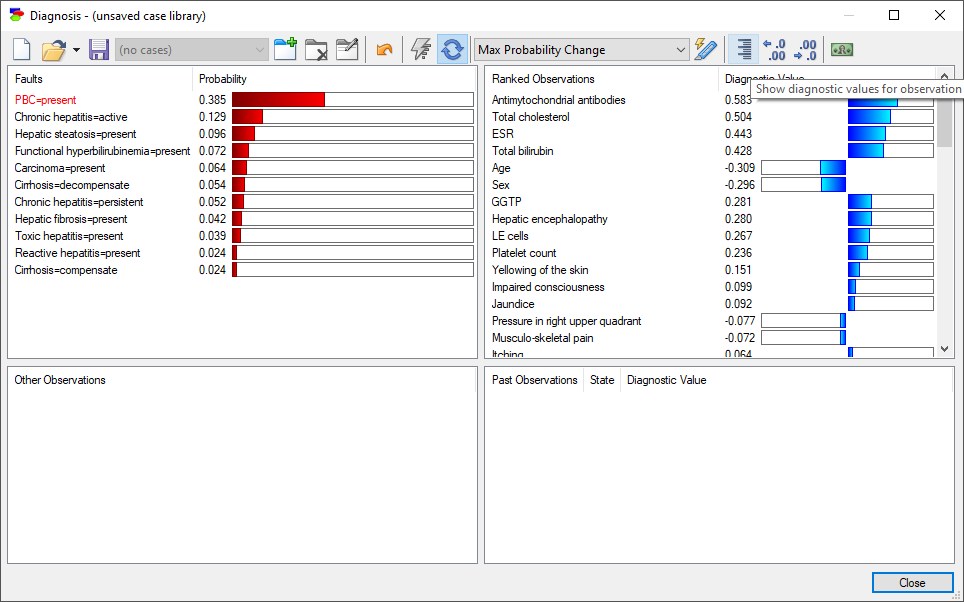
The Diagnosis Window has four panes, which can be described as follows:
•The top-left pane is for the Faults, which are non-observable and ranked nodes, typically representing various faulty components. The fault in red is the focus of the current diagnostic session. When the Diagnosis Window is just started, the most likely fault is the one selected to be the focus.
•The top-right pane is for the Ranked Observations, which are observable nodes that have not yet been observed, ranked from the most to least informative (from the highest to the lowest Diagnostic Value) to the focus of diagnostic reasoning (the faults in red).
•The bottom-left pane lists Other Observations, which are those observations that have been designated as Mandatory and are not yet observed. Their designation as Mandatory indicates that they are straightforward to observe or are otherwise part of the first steps and need to be observed first. They are displayed in red font in order to draw user's attention.
•The bottom-right pane contains all those nodes from among both the Ranked Observations and the Other Observations, that have been observed along with their diagnostic value, i.e., their contribution to the.
We will discuss various buttons placed on the top of the diagnostic window later in this section, in the context of the window's fundamental functionalities. Here we would like to point out three general purpose buttons:
Restart diagnosis button (![]() ) clears all observations made so far and starts with the clear observation slate.
) clears all observations made so far and starts with the clear observation slate.
Update button (![]() ) and Toggle immediate update button (
) and Toggle immediate update button (![]() ) control updating the window panes after making observations. We advise that the immediate update is on by default, unless update takes longer than desired. Update immediately, when set, makes GeNIe recalculate the ranking as soon as any change is made. If immediate update is off, you will need to press the Update button to recalculate the ranking. Please note that the calculations of diagnostic information value are computationally very complex and while SMILE is very fast and we have not experienced long wait times, with very large diagnostic models it may happen that this calculation takes too long.
) control updating the window panes after making observations. We advise that the immediate update is on by default, unless update takes longer than desired. Update immediately, when set, makes GeNIe recalculate the ranking as soon as any change is made. If immediate update is off, you will need to press the Update button to recalculate the ranking. Please note that the calculations of diagnostic information value are computationally very complex and while SMILE is very fast and we have not experienced long wait times, with very large diagnostic models it may happen that this calculation takes too long.
Enable relevance button (![]() ) becomes useful when networks are very large and it switches on a heuristic that ranks only those tests and faults that are relevant (in terms of being connected to) the observed set of evidence nodes. When this flag is off, some of the faults may be present and ranked in the diagnostic window purely because of their high prior probability.
) becomes useful when networks are very large and it switches on a heuristic that ranks only those tests and faults that are relevant (in terms of being connected to) the observed set of evidence nodes. When this flag is off, some of the faults may be present and ranked in the diagnostic window purely because of their high prior probability.
Focus of diagnostic inference: Pursuit of a fault
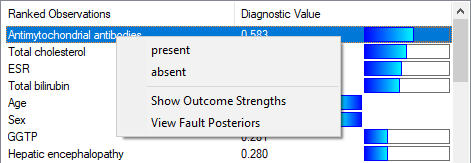
The first and foremost setting used in the calculation of cross-entropy is setting the focus of reasoning. The focus of reasoning is the fault displayed in red. When the Diagnosis Window is just started, the most likely fault is the one selected to be the focus. You can change the focus by selecting a fault state (or a set of fault states), right-clicking on the selection, and choosing Pursue (in the illustration below, Pursue PBC=present).
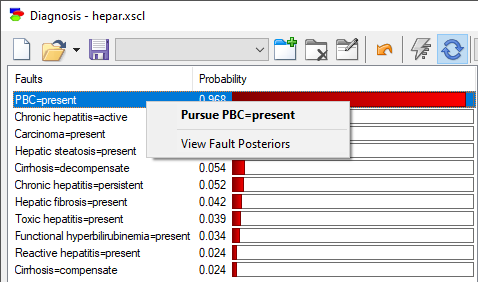
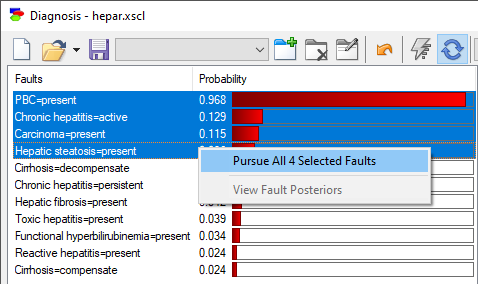
The selected fault will become the focus and will be displayed in red. The top-right pane will show a ranked list of observations that are relevant to the focus. We can select a group of fault states and pursue them all, in which case, the top-right pane will show a ranked list of observations that help us in differentiating among the selected states.
For the fault that is currently being pursued, it is possible to display its probability conditional on various observations. To view that list, please select View Fault Posteriors from the context menu. This will work also when pursuing multiple faults but the dialog always shows the probabilities for the fault that is selected by right-clicking on it.
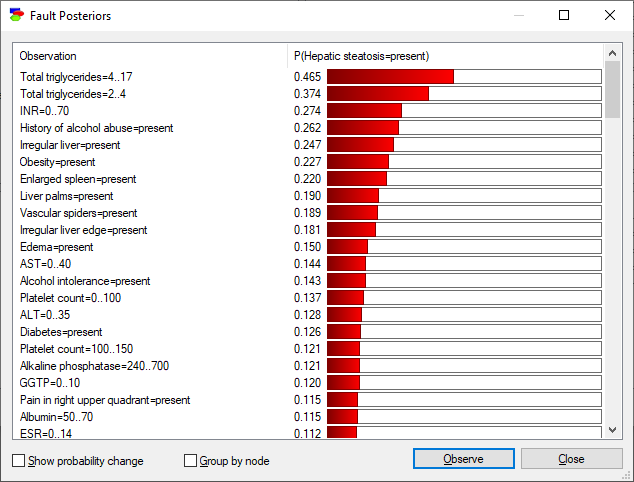
The ensuing dialog shows, in addition to the posterior probabilities of the pursued fault, two options: Show probability change and Group by node.
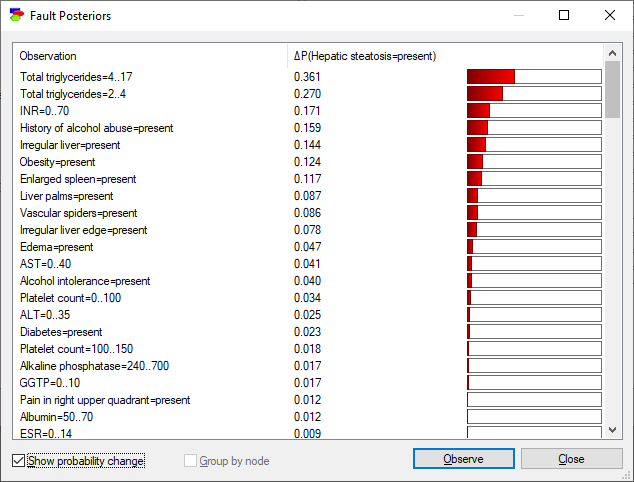
Show probability change displays the (absolute) change in probability of the selected pursued fault as a function of the possible observations:
Group by node sorts the list in such a way that all outcomes of a single node are placed next to each other:
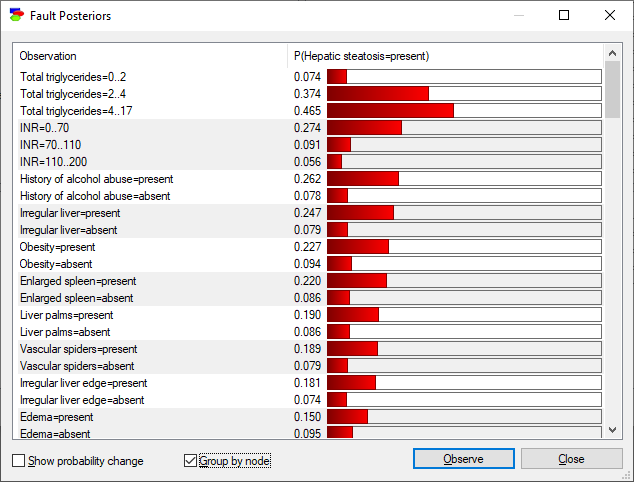
The list of observations is still sorted by the largest posterior probability of the pursued node. In case there is a large number of faults of ranked observations, it may become a challenge to find a fault or an observation that you are looking for. In such case, it is enough to type the first letter of the name of the fault or an observation to move within the window. Typing the first letter repeatedly moves you to the next fault or observation that starts with that letter.
Diagnostic Value of Information
The top-right pane shows a list of Observation nodes that have not yet been observed, ranked from the most to the least informative. The ranking is based on one of the selected measures of information, which we will discuss below. The measure used is displayed in the central part of the dialog header (the default, although as we will discuss later, not necessarily the measure that gives most insight, is Max Probability Change). The default measure (algorithm for diagnostic value of information computation) can be selected in Diagnosis tab of the Options dialog, available from Tools menu.
We will change the algorithm to Normalized Cross-entropy, the default measure in previous versions of GeNIe, by clicking on the Diagnostic value algorithm pop-up menu:
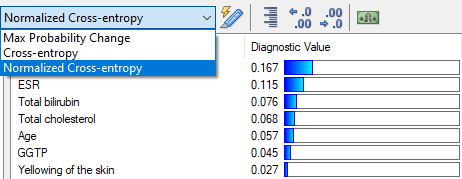
Cross-entropy is an information-theoretic measure that expresses, for each Observation node X individually, the expected reduction in entropy of the probability distribution over the fault nodes in red font in the top-left pane after observing X. Cross-entropy is a utility-free measure of value of information and it gives a good idea about the value of the observations for diagnosing the disorder in question.
Ranking the possible observations can be used as a guide for diagnostician what to do next. Each measure of the diagnostic value, including cross-entropy, is dynamic and it depends strongly on the collection of fault nodes and also on other observations. Calculation of each measure is computationally complex and involves a series of runs of a belief updating algorithm. It is useful to view the calculation of diagnostic value in GeNIe as a flexible alternative to pre-cooked list of questions. We all know how irritating it is to a customer to hear a phone support employee follow a standard "once-size-fits-all" set of questions that are typically irrelevant to the problem at hand. The ranked list calculated by GeNIe is always up-to-date and tells us at each step what to do next and what question makes the most sense.
Here is an example set of ranked observation nodes:
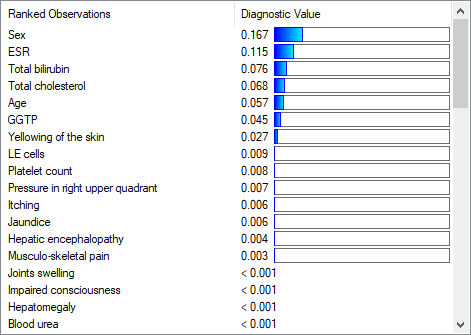
For each observation node, the window displays its diagnostic value numerically. Precision of this number is controlled by the buttons Increase decimal places (![]() ) and Decrease decimal places (
) and Decrease decimal places (![]() ) buttons.
) buttons.
While the graphical display is less precise, is is very convenient for quick judgment of relative value.
When a focus has never been selected explicitly, GeNIe will keep selecting the most likely fault to be the focus. When the user selects a focus explicitly, that focus stays throughout the diagnostic session.
Information/Cost Ratio
While cross-entropy is a unit-free measure, in some diagnostic applications diagnosticians may be more interested in monetary costs of the performed tests and benefits of observations. As you remember, one of the items specified for any observation node is the cost of observation. GeNIe offers a simple formula for combining cross-entropy with costs, notably a weighted additive scheme. Total benefits are V=cross-entropy-wC/wE * costs. The ratio α=wE/wC is called entropy/cost ratio and the formula for diagnostic value that includes α is as follows:
V = cross-entropy - α * costs
This ratio allows for a simple way of taking costs into account when looking at the value of observation. The default entropy/cost ratio is 1 but it can be changed easily through a simple dialog invoked by the Modify information/cost ratio button (![]() ) at the top-right of the Diagnosis Window. Pressing on this button invokes a simple dialog:
) at the top-right of the Diagnosis Window. Pressing on this button invokes a simple dialog:
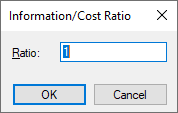
The Information/cost ratio is a real number ranging between 0 and 99999. The contents of the box in the Information/Cost Ratio dialog represents the value α and can be changed from 0 to 99999. If the Entropy/cost ratio is zero, then the ranking of Observations is based solely on cross-entropy and disregards to the costs of testing. Any higher number increases the role of cost in the ranking. As we change the Entropy/cost ratio, the ranking of Observations may change, reflecting the role of costs in the ranking.
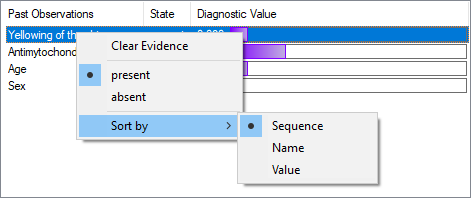
To record the value of an observation node (both the Ranked Observations and the Other Observations), right-click on the node name and select the observed state on the pop-up menu that show up.
Please note that the node will then show up in the bottom-right pane of the dialog window.
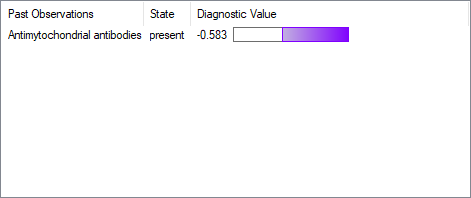
Past Observations Pane
The bottom-right pane contains all those nodes from among both the Ranked Observations and the Other Observations, that have been observed along with their diagnostic value, i.e., their contribution to the probability of the pursued fault(s).
The diagnostic value of the past observations is a dynamic measure and the contribution of each observation changes in the light of other observations, whether new or past. The list of past observations can be sorted by their name, diagnostic value, or order of observations.