The Spreadsheet View is a special extension of GeNIe that is useful in rapid building of diagnostic models - all properties of every variable of a model are listed in one window and the user specifying a model can move rapidly between variables and enter or modify their specifications. The Spreadsheet View is just another interface for viewing and modifying the definitions of individual variables. Changes made through the Spreadsheet View are saved in the individual variables. Changes made in individual variables will be visible in the Spreadsheet View.
To open the Spreadsheet View, the user must select Open Spreadsheet command from the Diagnosis Menu.
The Spreadsheet View consists of several columns of information that describe individual nodes (represented by rows) in detail. The information in the Spreadsheet View is also available in the Node Property sheets, although the Node Properties Sheet contains additional information that is not available in the Spreadsheet View, e.g., conditional probability tables.
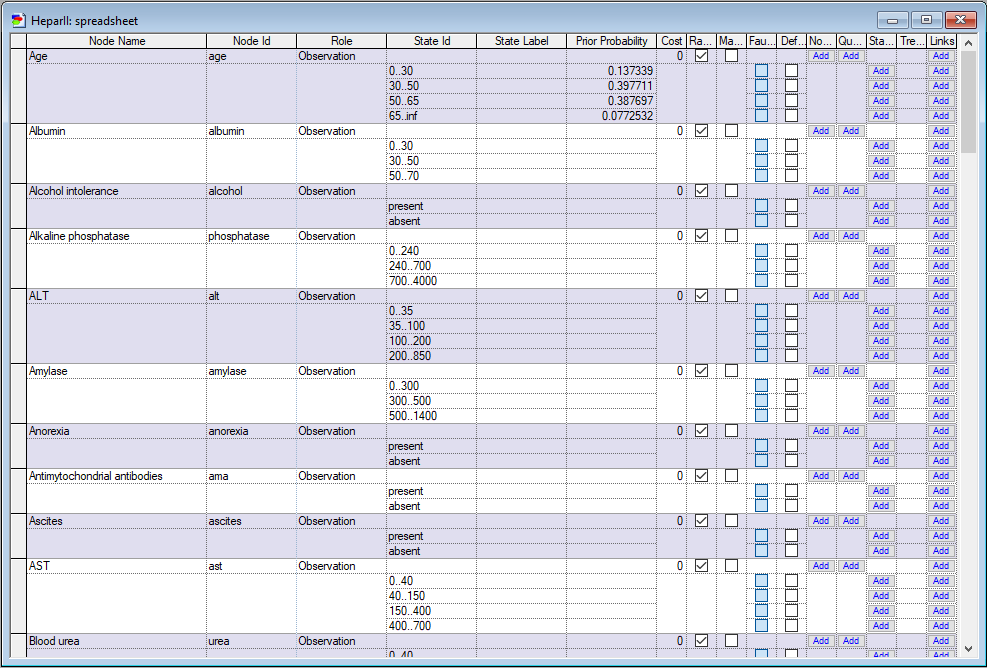
The columns of the Spreadsheet are described below in the order from left to right.
Node Name
Node Name is simply the name of the node that is being described. A node name can be changed manually by clicking on the box and typing the different name. The column can be sorted alphabetically by clicking on the Node Name label. In the figure above, the nodes are listed alphabetically starting with ALT and then AST.
Node ID
The Node ID column specifies a unique (among all nodes in the network) identifier for each node. Clicking on Node ID will change the order of the nodes from ascending to descending alphabetical order. Node IDs consist of a string of alphanumerical characters with no spaces (underscore characters are allowed).
Role
Role describes the diagnostic role of the node. By clicking on Role, the rows can be sorted according to their diagnostic roles. The diagnostic role can be changed manually by clicking on the box and by typing in a different name.
You can also change a node's diagnostic role by selecting the node (or a group of nodes) and selecting the Assign Diagnostic Role... from the Diagnosis Menu. This opens the Assign Diagnostic Role dialog described in the Diagnosis Menu section.
For more information on the functions of the various types of nodes, see Defining diagnostic information section.
State ID
The State ID column lists the node's states. For example, node Alcohol intolerance has two states: present and absent. ALT, which is a numerical node specified by means of intervals, has four states (intervals): 0..35, 35..100, 100..200 and 200..850. Each of node states is described further in the spreadsheet. A state ID, which consist of a string of alphanumerical characters with no spaces (underscore characters are allowed), can be changed manually by clicking on a corresponding cell and typing in a different ID. Please remember that state IDs have to be unique within a node.
State Label
The State Label is a unique identifier for each state of a node. The State Label can be changed manually by clicking on a corresponding cell and typing in a different label. State Label consist of a string of alphanumerical characters with no spaces (underscore characters are allowed) and should be unique in the entire model.
Prior Probability
Prior Probability column displays the prior probability distribution over the states of root nodes (i.e., nodes without parents). Many nodes in diagnostic models fall into this category and including this column in the spreadsheet is a compromise between having all distributions and avoiding the complexity of multi-dimensional conditional probability tables. Prior probabilities for components indicate how likely the components are to fail (it can be based on expert opinion or on objective data, such as average frequency of failure across the fleet). For example: a given component, A, may have a prior probability of being in the state Defective equal to 0.001 and of being in the state OK equal to 0.999. This prior probability means that only in one locomotive in a 1000 will the component A be defective per shop visit. To change the prior probabilities of a faulty component, locate the row of the node for which the probability is to be changed. Then locate the rows representing the states of the node. After finding the appropriate row, scroll right until you reach the column in the Spreadsheet View labeled Prior Probabilities. Click on the box representing the probability of the state and type in the new probability. Enter the probabilities for the other states as well. The sum of prior probabilities over all states of a given node has to be equal to 1.0. In the figure above, the states of node Age are age65_100, age51_65, age31_50, and age0_30 and have prior probabilities of 0.0772532, 0.387697, 0.397711, and 0.137339, respectively. If the prior probability of a node representing a faulty component is changed to zero then this fault is effectively eliminated from the process of diagnosis. In some cases, the faulty component nodes are dependent upon other nodes, such as nodes representing versions of the hardware, e.g., engine type. To change the probability of failure of such nodes, one needs to enter new values into the conditional probability table in the Definition tab of Node Property sheets.
See Definition tab section of Node Property sheets for more information on how to enter data into the conditional probability tables (CPTs).
Cost
The Cost column is defined for Observation nodes only. Cost contains a simple cost of a tests or an observation represented by the node. The Observation cost can also be specified from the Node Property sheets for the node. See the Cost of observation section for more information.
Ranked & Mandatory
The Ranked and Mandatory columns are used to represent subtypes of each node role. Checking and unchecking the boxes in corresponding columns specifies their subtype. More than one subtype may be selected for a given node role, i.e., a node can be both Ranked and Mandatory. Legal combinations of the two are described in the Defining Diagnostic Information section. If a box has been grayed out, then it does not pertain to the particular node role and cannot be changed.
The Ranked and Mandatory status can also be specified in the Diagnosis Tab in the Node Property sheets.
Fault State & Default State
The Fault State check box specifies whether a state is a disorder/malfunction or not. The Default State points out a state that is the default observation, i.e., other information lacking, the node is set to that state. If the region is gray, then the column in question does not pertain to the node.
The Fault and Default status can also be specified from the General Tab in the Node Properties Sheet. See the General Tab section of Node Property sheets for more information on how to do this.
Node Description
The Node Description column contains a short text defining the node and its states. To edit the Node Description column, click the button labeled Edit or Add. Add indicates that there is no description available for the node. Edit indicates that a description has been already entered for the node and it can be edited. Clicking on Edit or Add buttons results in a new window, in which the user can add the description.
The Node Description can also be specified from the Documentation tab in the Node Property sheets. See the Documentation Tab section of Node Property sheets for more information on how to do this.
Question
The Question column applies to Observation nodes only and describes in the form of a question what the observation is supposed to answer. The contents of the Question column is edited similarly to the Node Description column. The Question can also be specified in the Documentation tab in the Node Property sheets. See the Documentation Tab section of Node Property sheets for more information on how to do this.
State Description
The State Description column contains a short text describing the state. The contents of the State Description column is edited similarly to the Node Description column. The State Description can also be specified from the Documentation Tab in the Node Property sheets. See the Documentation Tab section of Node Property sheets for more information on how to do this.
Treatment
The Treatment column describes how to treat the defect represented by the state and applies to Fault states only. It will be grayed out for all other states. The contents of the Treatment column is edited similarly to the Node Description column. The Treatment can also be specified from the Documentation Tab in the Node Property sheets.
Links
The Links column, similarly to the preceding columns, contains a short text consisting of hyperlinks. These links in most cases are pointing to documents with additional information, such as further documentation for the nodes and states. These documents can be used to repair procedures, schematics, block diagrams, manuals, etc. Links have names describing what the documents contain and the address of the document. The contents of the Links column is edited similarly to the Node Description column.
The Links can also be specified from the Documentation Tab in the Node Property sheets.
Node properties menu in spreadsheet view
Right-clicking on a node in the spreadsheet view brings up the Node Pop-up menu
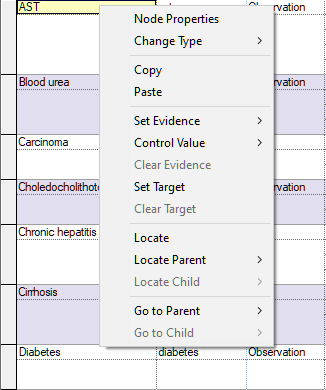
Most of the choices are the same as in the Node Pop-up menu in the Graph View.
Copy and Paste copy currently selected text onto the clipboard and pastes current contents of the clipboard, respectively. The pair is useful for copying text between cells.
Locate is used to locate the selected node in the Graph View. Once located, the node is flashed several times on the screen to make it visible to the user.
Go to Parent and Go to Child allow for moving around in the Spreadsheet View. They locate the selected parent or child and move the cursor to the corresponding line in the spreadsheet.