Diagnostic features of GeNIe are generally accessed through the Diagnosis Menu and they are typically set through the Diagnosis Tab in Node properties tabs.
Setting properties of model variables for diagnostic applications
The critical element of diagnostic extensions is setting the roles that various nodes play in diagnosis. Each defect, error message, symptom, and test is represented as a separate node of a graphical causal model that is at the foundation of a Bayesian network model. Since a general purpose Bayesian network model does not make a distinction between the meaning of different types of nodes, the modeler has to indicate which of them represent defects, which are observations, and which are possible tests. For example, nodes representing components can have states labeled OK and Defective. For nodes representing symptoms or error messages, the states can be Present and Absent. For test nodes, the states could be labeled Passed and Failed. Nodes are connected together in the Bayesian network using directed links. The links typically follow the causal direction, i.e., go from the nodes that represent possible faults to nodes representing observations, error messages, tests, and symptoms. A link from a given component to a symptom can indicate that the symptom can be caused by the defects of the component. A link from a given component to a test can indicate that the test can be used to determine whether or not the component is defective.
Nodes in GeNIe's diagnostic extensions are divided into three classes: Faults (these are abnormalities such as machine failures, defects, or diseases), Observations (these are observable symptoms or risk factors), and Auxiliary (these are additional variables, which are neither faults or observables but are useful in specifying the model). All nodes in a diagnostic model must be Chance type nodes.
The Diagnosis tab in the Node properties sheet can be used to enter new properties or alter current properties for a single node.
Diagnosis tab
Shown below is the snapshot of the Diagnosis tab of the Node properties sheet (please note that the diagnostic extensions need to be enabled for this tab to be visible).
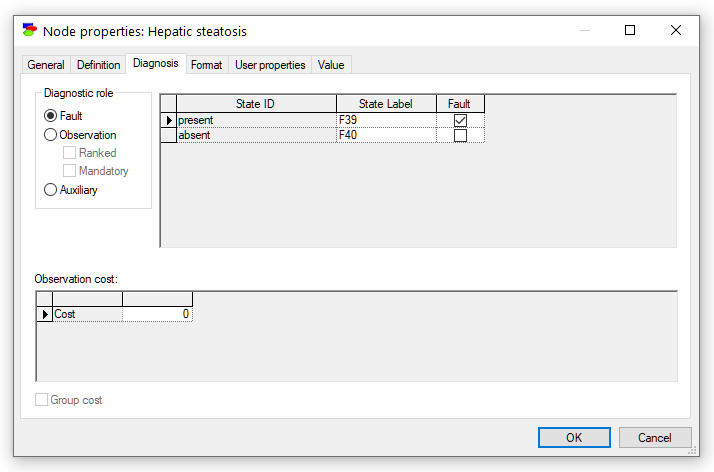
Fault nodes represent machine failures, hardware defects, disorders, etc. At least one state of a Fault node must be designed as a Fault state (check-box on the right-hand side). A fault state is the defective state, so all states that are not designated to be Faults are normal states by default.
Observation nodes represent variables that are observable in the process of diagnosis, such as historical data, error messages, symptoms, or test results.
Auxiliary nodes are all other nodes and are neither faults nor observations. They are typically used for modeling convenience.
In addition to the three node types, there are also two node subtypes of Observation nodes: Ranked and Mandatory.
Observation Ranked nodes are the most common observation nodes. They are ranked by the diagnostic Diagnosis Window according to how informative they are with respect to the faults. They represent observations, whose states are unknown in advance but that are useful in diagnosis. The purpose of a Observation Ranked node is to find out how an observation ranks relative to other possible observations before it is performed by displaying a list ranked in terms of its effectiveness in troubleshooting. These tests are ranked in the Ranked-Observation pane of the diagnostic Diagnosis Window.
Observation Mandatory represents information that needs to be provided in advance. It may represent an action, a testing condition, or any other factor that needs to be performed or observed before the troubleshooting begins.
Faults appear always on the list of ranked faults in the Diagnosis Window. Fault components are ranked in terms of their probability. Each of the Fault states will be listed along with its probability.
All of the above can also be edited in the Spreadsheet View.
The following table lists the diagnostic types with their typical uses and the Ranked/Mandatory options:
Diagnostic Type |
Typical use |
Ranked/Mandatory status |
|---|---|---|
Fault |
Faulty and defective components or medical disorders |
Ranked |
Observation |
Error messages, symptoms or tests |
None / Ranked / Mandatory |
Auxiliary |
No specific use, only for modeling convenience |
None |
State Label field allows to define an additional state label, which can be referred to in embedded diagnostic applications. GeNIe and SMILE provide only means for storing, retrieving, and editing this field.
Note : State IDs must be unique within the same node.
Node property tabs is just one way of entering diagnostic information. For existing models, diagnostic roles can be set by means of the Assign Diagnostic Role dialog, which can be invoked through the Diagnosis Menu. The Assign Diagnostic Role dialog allows for doing it in batches for all nodes in the Graph View that have been selected before invoking the dialog. Please look at the description of the Assign Diagnostic Role dialog in the Diagnosis Menu section. Yet another way of entering diagnostic information is described in the Spreadsheet View section.
Cost of observation
The Observation cost allows for entering the cost of observing the value of the current node. The cost of performing a test can be expressed on some scale, e.g., currency or time in minutes. The cost entered can be any real number or can be N/A (or a shorthand na or NA) when the cost is not applicable. Costs can also be entered in the Spreadsheet View.
It is possible to enter negative values as costs. Negative values indicate costs that are so inexpensive that they should always be performed. For example, it may cost close to nothing to determine the biological sex of a patient and doing so gives some information about the likelihood of various disorders. The same holds, for example, for car make and type or engine version in case of diagnosing a car - they are all readily available. Negative costs can be identified in the Diagnosis Window when the option Enable Quick Tests is on.
Note : The Group Cost check box is enabled only if the current node has more than one child. For more information on how to use Group Costs see Group Costs section of Cost of Observation section.
For more information on how to use cost of observation in your network see Cost of Observation section.