Once a data set is open, Menu Bar is extended with Data menu.
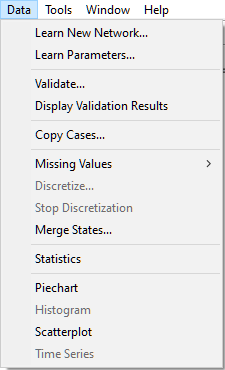
The Data Menu offers the following functions, all discussed in various sections of this chapter:
Learn New Network... starts a dialog for learning a new graphical structure from the data set. See Structural learning section for more information.
Learn Parameters... allows for learning the parameters of an existing network from the data set. See Learning parameters section for more information.
Validate... invokes a validation dialog that allows to evaluate the accuracy of a model based on the data. See Validation section for more information.
Display Validation Results, when applied to a validation data file that has been created earlier by GeNIe, allows to examine validation results. See Validation section for more information.
Log Likelihood... calculates the log likelihood of the data given a model. This is a measure of fit of the model to the data. See Validation section for more information.
Export Cases to Network... allows for importing cases from the data into a network. This function is described in the Case manager section.
Data pre-processing commands
The remaining choices in the Data Menu offer various functions for viewing and pre-processing data. They are all described in detail in the Cleaning data section.
Missing Values submenu gives various options for dealing with missing values in the data.
Discretize... opens a dialog for discretizing the data.
Stop Discretization returns the data to their original values, reversing the discretization.
Merge States... opens a Merge States dialog that allows the user to merge states of a variable and assign a new name to the merged states.
Statistics opens a Statistics Dialog that displays useful statistics for the variables included in the data.
Fit Metalog Distribution opens a dialog that aims at fitting a Metalog distribution to a variable (column) in the data. See Fitting metalog distribution to data section for more information.
Piechart displays the distribution of data for the selected variable on a piechart graph.
Histogram displays the distribution of data for the selected variable on a histogram graph.
Scatterplot displays the scatterplot graph for two selected variables.
Time Series displays a plot of values of the selected variable indexed by the record number.