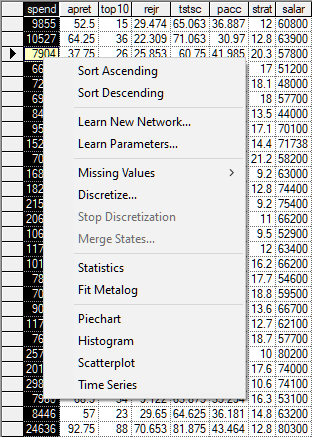
One added functionality of the data spreadsheet interface is learning the (marginal or conditional) probability distributions that have generated the data. We have described the simple functionality of learning the CustomPDF distribution through the histogram interface in the Cleaning data section. There is an even more powerful functionality for learning the metalog distribution from data. To invoke this functionality, please select Fit Metalog from a column context menu:
This will invoke the following dialog
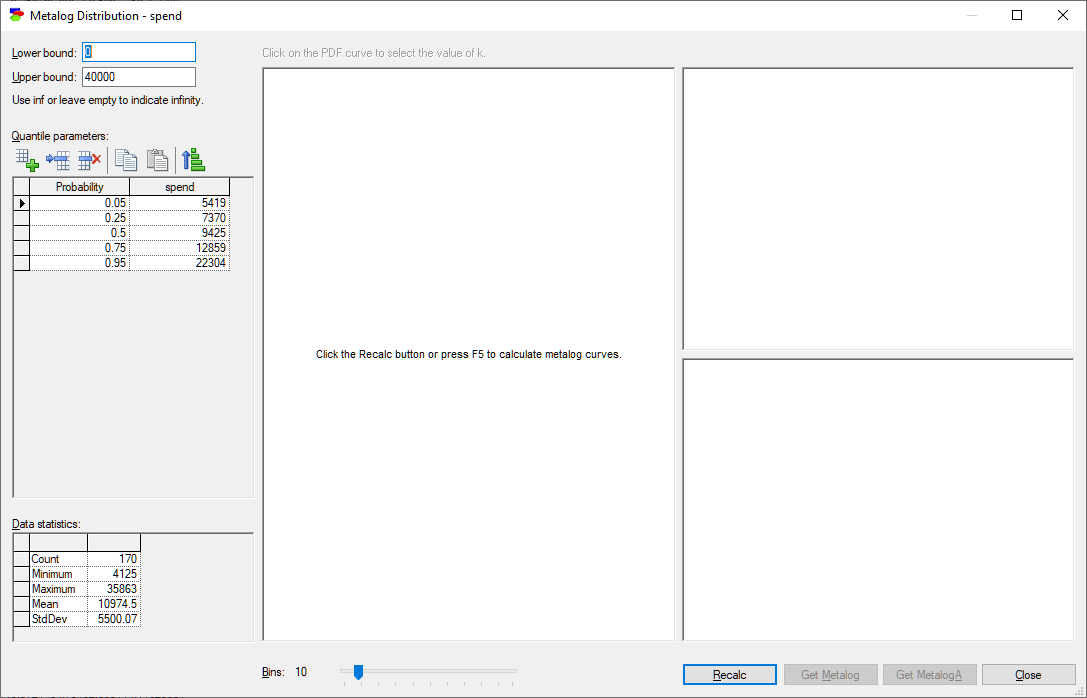
Lower and upper bounds are extracted from the data, although they are somewhat generous, rounded down and up respectively. Both can be modified by the user. To make the bounds infinite, please enter -inf and inf respectively or leave the bound field empty. The bottom-left corner shows basic statistics of the selected data column.
Input parameters are probabilities and the corresponding quantiles. The default probabilities are 0.05, 0.25, 0.5, 0.75, and 0.95. Generally, the higher the number of quantiles specified, the more complex and flexible the distribution. However, high number of quantiles carries the danger of overfitting the data, so we advise prudent caution, looking at the distributions generated for different values of k, and selecting a not-too-high value of k that produces the desired distribution.
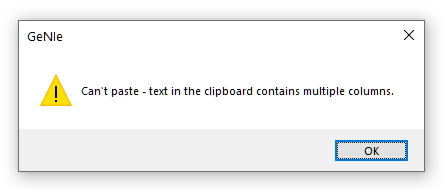
Editing the table comes with a similar set of tools as editing probability tables (Add, Insert, and Delete buttons). Probabilities do not need to be sorted a-priori, as GeNIe will validate and sort them for you before it starts with the process of fitting metalog distributions to data. You can sort the entries explicitly by pressing the Sort button (![]() ). GeNIe is also tolerant to empty rows between values. The two columns are inter-dependent given the data and changing the value in one column will lead to recalculating the value in the other column. Both columns can be copied and pasted. Pasting is restricted to one column because of the interdependence of the two columns. Pasting a text block that has more than one column does not make sense and will result in an error message.
). GeNIe is also tolerant to empty rows between values. The two columns are inter-dependent given the data and changing the value in one column will lead to recalculating the value in the other column. Both columns can be copied and pasted. Pasting is restricted to one column because of the interdependence of the two columns. Pasting a text block that has more than one column does not make sense and will result in an error message.
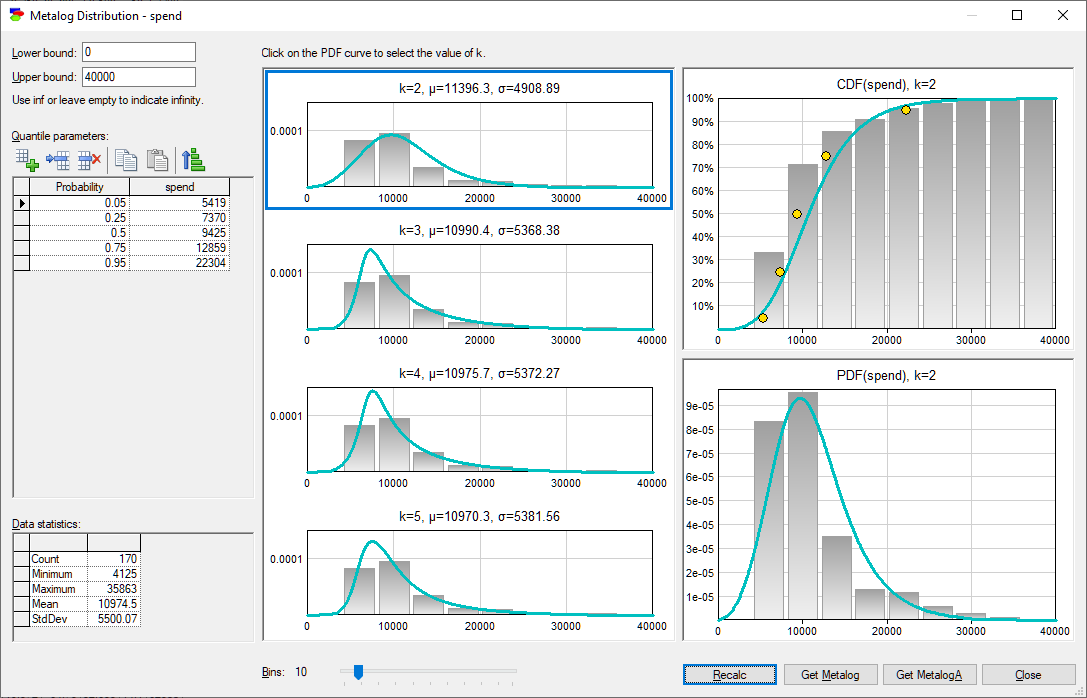
Pressing Recalc button shows a set of plots of the metalog distributions for k=2 through n that fit the data, where n is the number of input parameters (quantiles of the distribution). Only the feasible metalog distributions are shown, so the number of distributions may be smaller than n-1. As the number of quantiles specified in the example is 5 and all four metalog distributions are feasible, the dialog displays distributions for k=2, 3, 4, and 5. Histograms of the data are shown in the background so that the user can make a judgment of the goodness of fit. Generally the higher the value of k, the more flexible the distribution but it is worth looking at the distributions generated for different values of k to make a conscious choice. Mean and standard deviation of every metalog distribution are shown above each plot.
Changing the number of bins (effectively, the bin size, as all bins are equal width) often leads to additional insights about the goodness of fit.
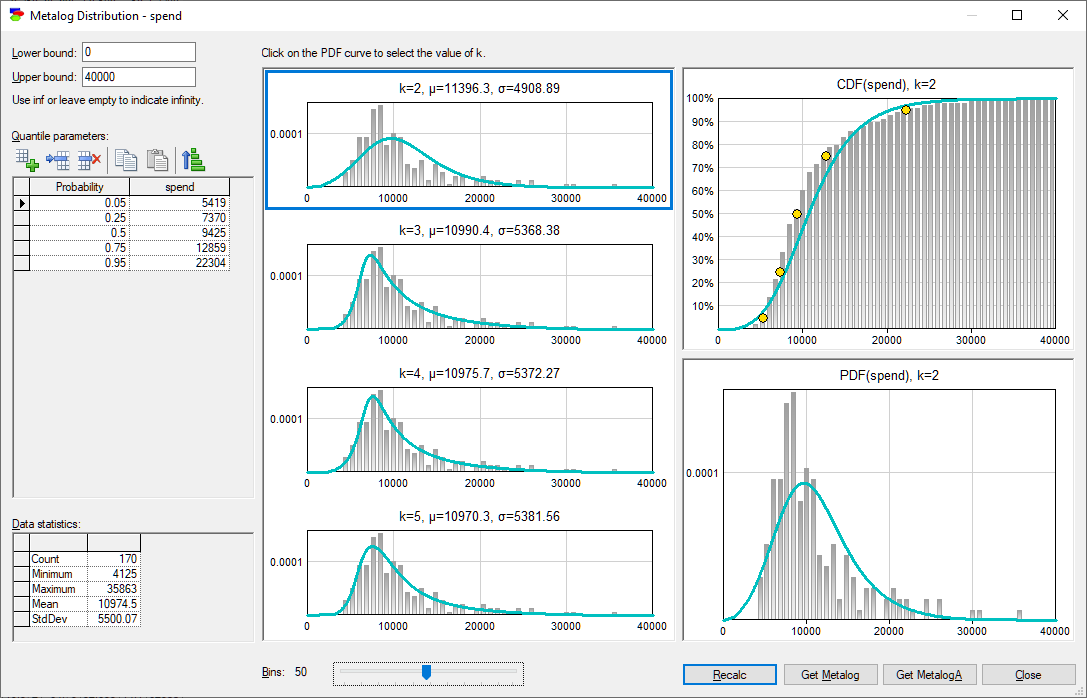
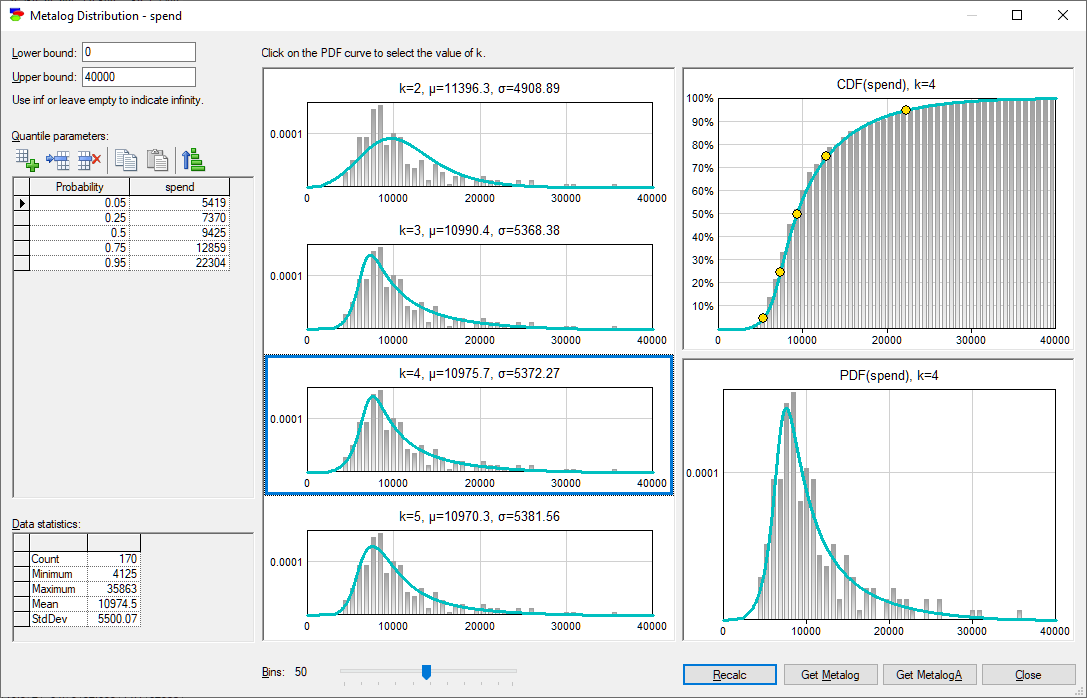
Clicking on any of the four plots displays the CDF and PDF of the distribution on the right-hand side. The CDF plot shows the input percentiles. Obviously, the closer the points are to the CDF line, the better the fit.
Any histogram in the dialog can be copied and later pasted as a picture into any other Windows application by right-clicking on the histogram and choosing Copy.
The buttons Get Metalog and Get MetalogA copy the formal description of the chosen metalog function for pasting elsewhere (usually in the definition of some node in your model).
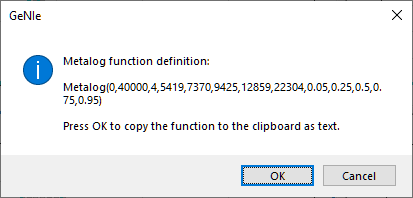
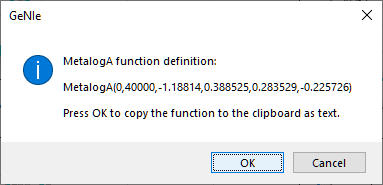
As explained in the section on Random number generators, the difference between the Metalog and MetalogA functions is that the latter uses internal metalog coefficients that do not have easily interpretable meaning. Metalog, on the other hand, uses parameters that are percentiles of the distribution. One might expect that MetalogA is more efficient in sample generation, as it skips the whole process of deriving the distribution from which it subsequently generates a sample. However, GeNIe has an efficient caching scheme that makes Metalog equally efficient in practice.
For more information about the metalog distribution, please look at the comprehensive article on the topic on Wikipedia (https://en.wikipedia.org/wiki/Metalog_distribution), the Metalog Distribution web site created by Tom Keelin (http://metalogdistributions.com/) or the Metalog Distributions YouTube channel, educational videos (https://www.youtube.com/channel/UCyHZ5neKhV1mSsedzDBoqyA). These sources provide access to articles by Tom Keelin and colleagues on the topic of the metalog distribution.