One of the important elements of probabilistic modeling is the ability of directed probabilistic graphs to represent the causal structure of the modeled domain. The structure itself is very valuable and is an important source of insight. Models built by means of QGeNIe can be examined structurally. An important element of this analysis is the structure itself, viewing the strengths of influences and pathways through the graph. This section describes tools for the analysis of the graph structure.
Dimming unnecessary arcs
Dimming unnecessary arcs, discussed earlier in this manual, is a simple tool that allows for finding one class of modeling errors, errors of omission. One such error is having an influence arc that has zero numerical effect. QGeNIe shows such arc as dimmed, as they are unnecessary and are quite likely the result of an error. Whenever you see a dimmed arc, please have a look at the child node and its parents - chances are that it is not that the arc is unnecessary but rather that you have forgotten to set the numerical value of influence of the parent node on the child node.
Locating disconnected nodes
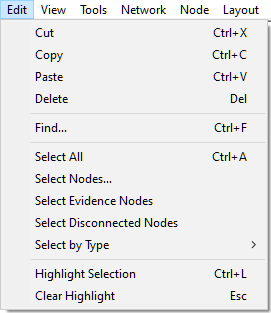
When modeling, many a user create a collection of nodes and then connect them by means of arcs. When the model under construction is sufficiently large, it is not uncommon to forget about some of the nodes and leave them unconnected to the rest of the network. Locating disconnected nodes is a functionality that helps to find such nodes so that we can give them more attention. To find disconnected nodes, please select Select Disconnected Nodes from the Edit Menu:
If there are no disconnected nodes in the model, this choice is going to be grayed out. Nodes selected can be subsequently highlighted (choice Highlight Selection or Ctrl-L in the Edit Menu) and easily located in the Graph View visually.
Strength of influence
Clicking on the Enable variable arc widths (![]() ) tool from the Standard Toolbar changes the appearance of the arcs in the network. The arc have different thickness, dependent on the strength of influence between the nodes that they connect. Strength of influence is based on the arc weight parameters, entered during the construction phase of the model.
) tool from the Standard Toolbar changes the appearance of the arcs in the network. The arc have different thickness, dependent on the strength of influence between the nodes that they connect. Strength of influence is based on the arc weight parameters, entered during the construction phase of the model.
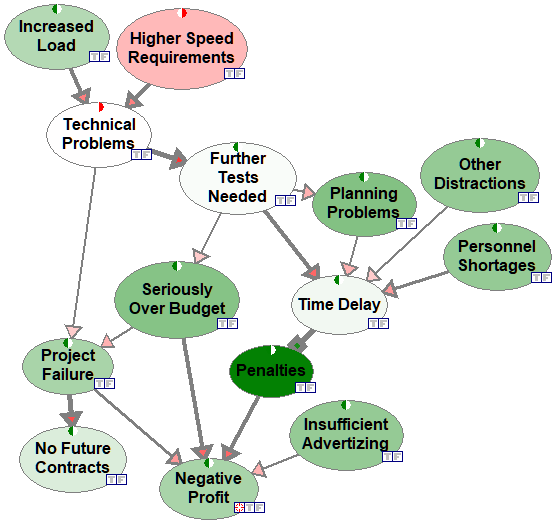
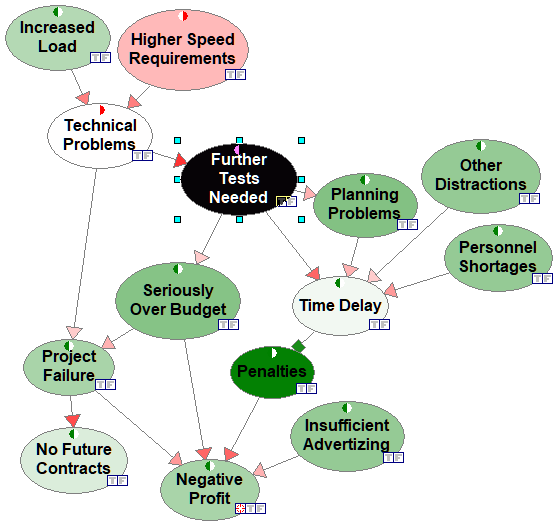
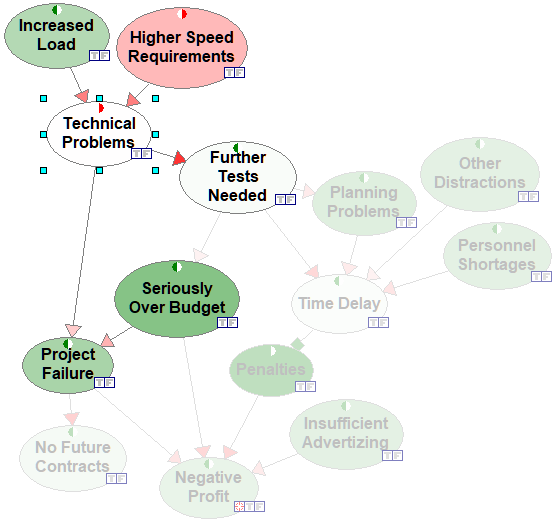
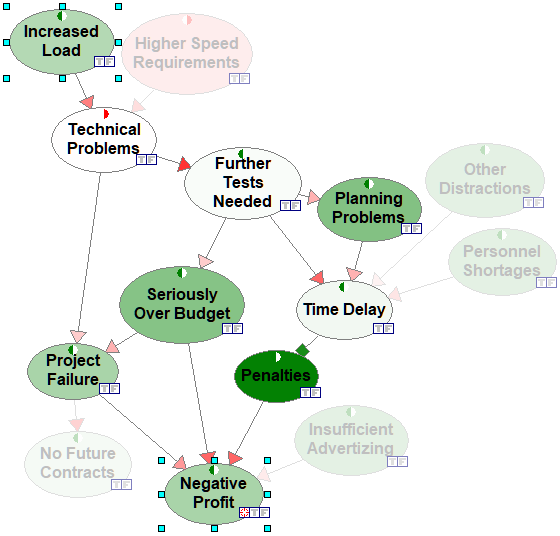
Here is a fragment of the Project network with the Enable variable arc widths tool pressed.
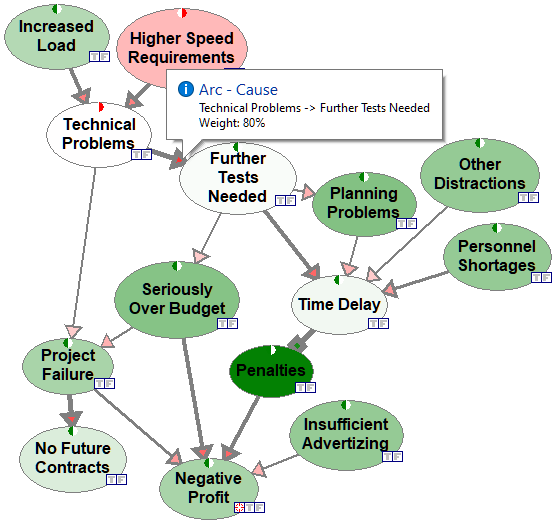
If the mouse is placed on the head of the arrow, information relating the strength of influence is shown in a comment box. The image below shows the strength of influence of the arc between Technical Problems and Further Tests Needed.
Variable arc widths allows for structural analysis of the model, as the show the strength of influences and, by this, the most critical paths of information flow. They allow for a visual verification of the intuitions that are captured in the model. The above screen shot of the Project model show, for example, that the most critical pathway influencing profits is through customer demands for increased load and higher speed, which may result in technical problems, need for further tests, budgetary problems, time delay, and penalties, resulting in decreased profits.
Neighborhoods
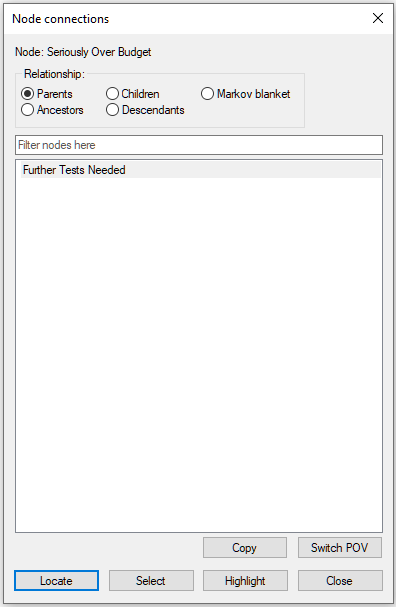
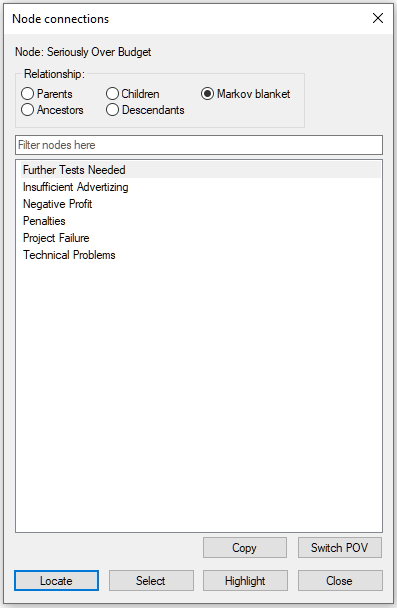
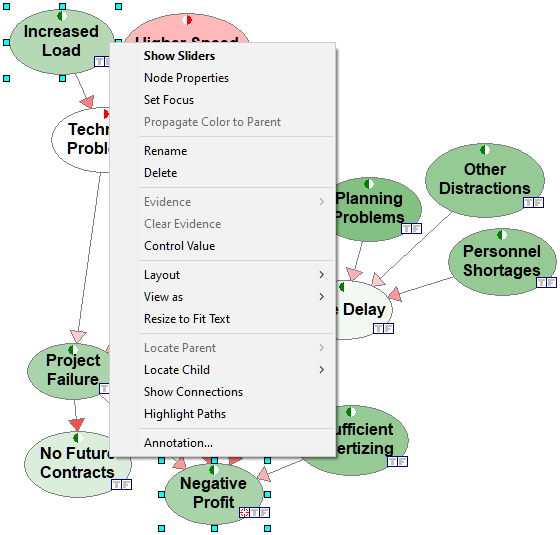
There are several useful functions that help with analysis of connections and pathways through the qualitative graph. One group of such functions is showing connections of a selected node. To open the connections dialog, please select Show Connections from the context menu of the node in question. The image below show invoking the dialog for the node Seriously Over Budget.
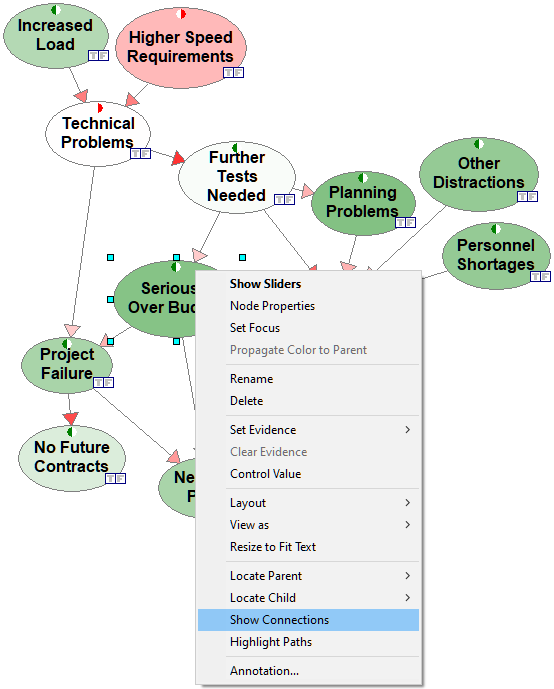
The dialog allows for selecting parents (direct predecessors in the graph), children (direct successors in the graph), ancestors (all predecessors in the graph), descendants (all successors in the graph), and the node's Markov blanket (the set of nodes that make the node in question independent of the other nodes in the graph). The only parent of the node Seriously Over Budget in the graph is Further Tests Needed.
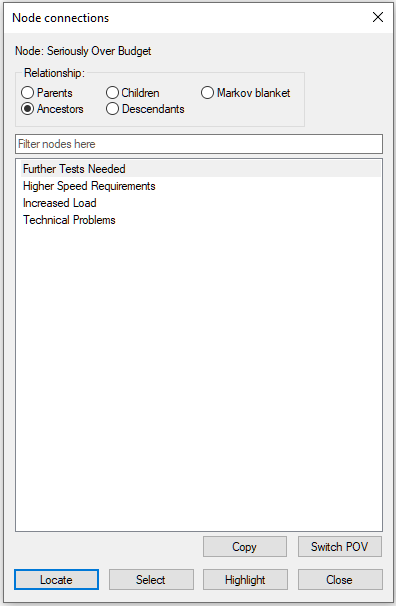
Further Tests Needed is also a part of the ancestors of the node Seriously Over Budget.
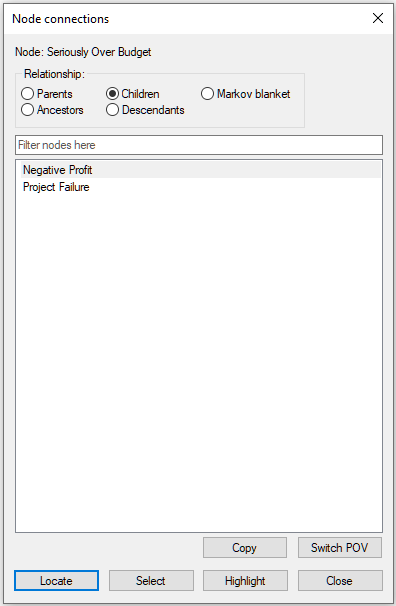
Seriously Over Budget has two children: Negative Profit and Project Failure.
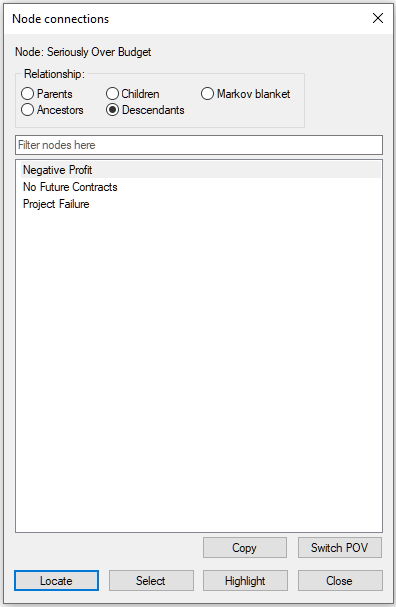
They both belong to the descendants of Seriously Over Budget.
Parents, children, and the parents of those children belong to the Markov blanket of the node Seriously Over Budget.
The dialog allows for traversing the graph through changing the focus of the analysis. A new focus can be chosen by selecting it from the list of nodes and pressing the Switch POV (Point of View) button in the lower-right corner of the dialog. Let us select Technical Problems and press the Switch POV button.
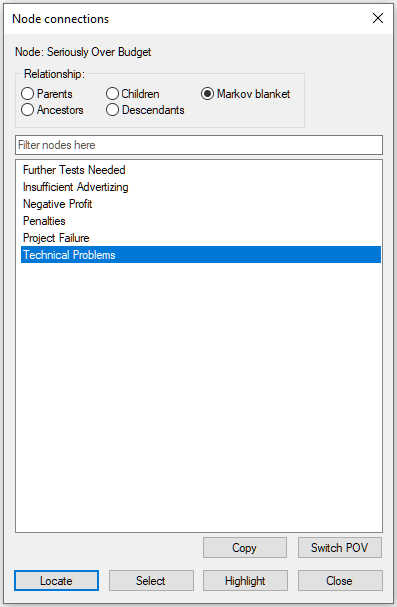
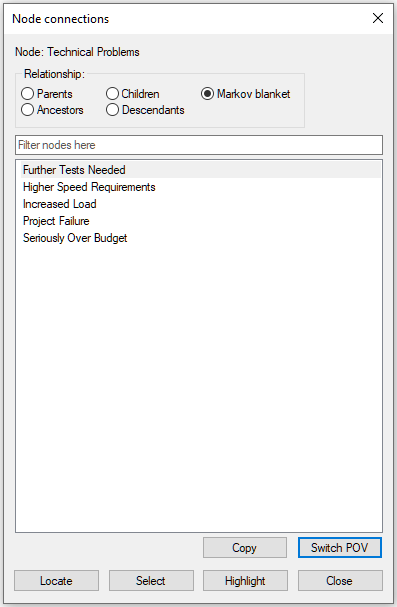
Pressing the Switch button leads to refocusing the neighborhood to the node Technical Problems.
Selecting any of the nodes on the list and pressing Locate node button locates the node in the Graph View and flashes the node three times. Double-clicking on the selected node has the same effect. Selecting Further Tests Needed and pressing the Locate node button yields:
Pressing the Highlight all button exits the dialog and highlights all nodes on the list. In the image below, Highlight all button was pressed when the Node connections dialog showed the Markov blanket of the node Technical Problems.
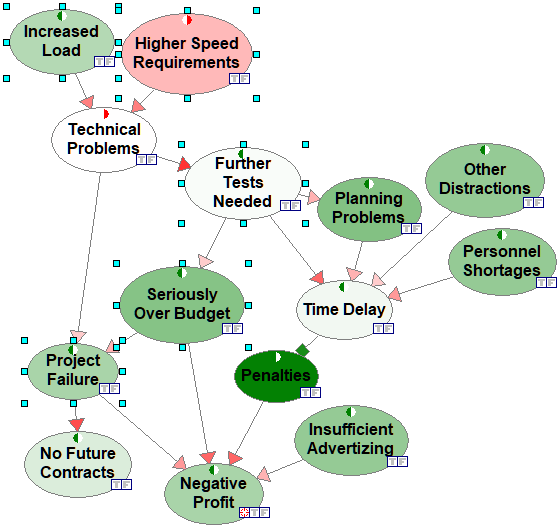
Pressing ESC or choosing Clear Highlight from the network pop-up menu will clear the selection.
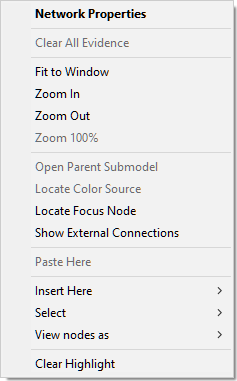
Pressing Select button in the Show Connections dialog selects all nodes on the list (selection does not include the POV node!) in the Graph View. In the image below, Select button was pressed when the Node connections dialog showed the Markov blanket of the node Technical Problems.
This selection can be further enhanced through other ways of selecting nodes and arcs. Please see the Select Nodes... dialog, described in the Selection of model elements section.
Pathways of information flow
QGeNIe allows for showing active paths through which information flows between a pair of nodes. To show all paths between two nodes A and B, please select these two nodes and choose Highlight Paths from the node context menu of one of the two nodes. The following image shows how to invoke highlighting paths between the nodes Increased Load and Negative Profit.
The result of choosing Highlight Paths above is
Pressing ESC or choosing Clear Highlight from the network pop-up menu will clear the selection.