QGeNIe is all about exploring models and viewing results of calculations after observing evidence and performing manipulations. There are several ways of viewing interesting information from a model.
Probabilities of various propositions
Probabilities of propositions can be viewed in several ways. The easiest, one that does not require any action, is observing the colors of nodes, which represent probabilities of truth (of falsity -- this can be set in node properties) of the proposition represented by the node. The Productivity model, used in the Building a qualitative Bayesian network section, shown below, shows the probabilities of each of the four propositions represented by the four model variables
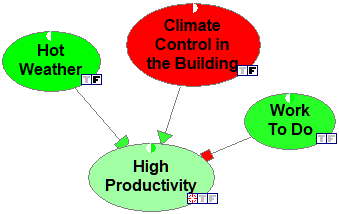
Climate Control in the Building is marked as observed to be false and it is also bright red, showing that the probability of the climate control in the building is zero (either because of absence of an AC unit or because it is broken). Hot Weather is marked as observed to be false and it is also bright green (please note that the colors for the node Hot Weather are reversed, so green denotes falsity of the proposition), showing the the probability of the weather being hot is zero. High Productivity, the focus variable in the model, has a probability between 0.5 and 1.0 judging by the node color. The small circle in the upper part of the model shows probability 0.5 and 1.0 by its white and intensive green halves. Clearly, the node color is closer to green than it is to white.
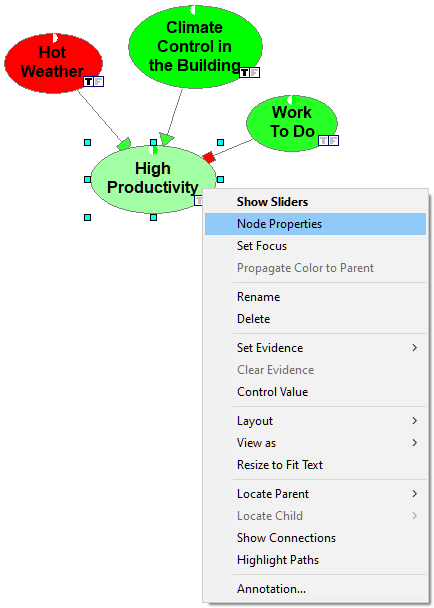
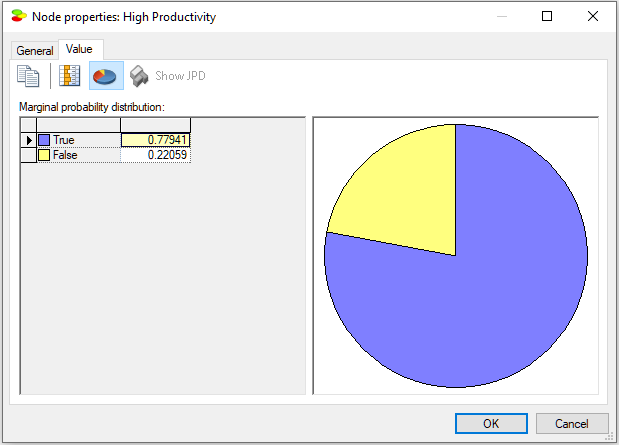
It is possible to see the exact numerical values of the probabilities by opening the properties of any node. Let us open the properties of the node High Productivity:
The Value tab shows the probability of truth of High Productivity is 0.74929816.
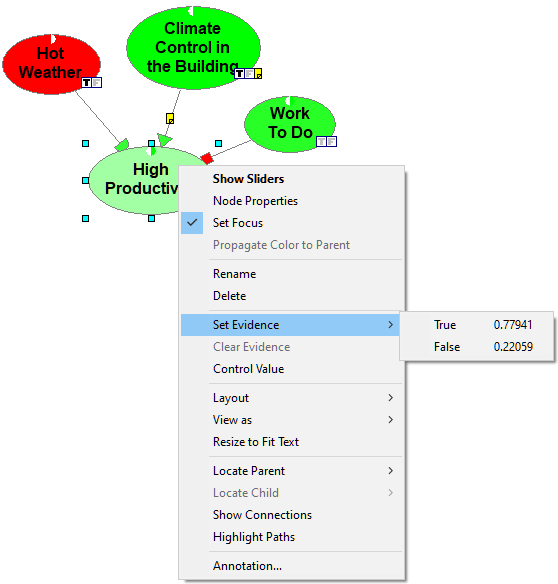
You can also right-click on the node and choosing Set Evidence. GeNIe shows a list of states of the node along with their probabilities, when these are available.
There are other model elements that belong to broadly-understood results that you can view through QGeNIe interface. We will discuss these in the following sections of the manual: Structural analysis, Value of information/manipulation, and Inference in DBNs.