An important element of model learning is selecting variables that are most informative from the point of view of a task, which is typically prediction, diagnosis, or classification. It has been a robust finding of machine learning methods that sometimes reducing the number of features (variables that are used in prediction) improves the model quality. There is no explicit command to perform feature selection in GeNIe. The problem is, in general, rather hard but there are several techniques that we would like to recommend to GeNIe users.
Correlation matrix
One of the simplest ways of selecting important variables is based on the strength of connections between features and the class/predicted variable. It can be proven that in case of long causal chains, the farther a variable is from the class variable, the weaker the dependence between this variable and the class variable. In case of a set of numerical variables that are distributed according to the multivariate Gaussian distribution, it helps to examine the correlation matrix (see the Cleaning data section).
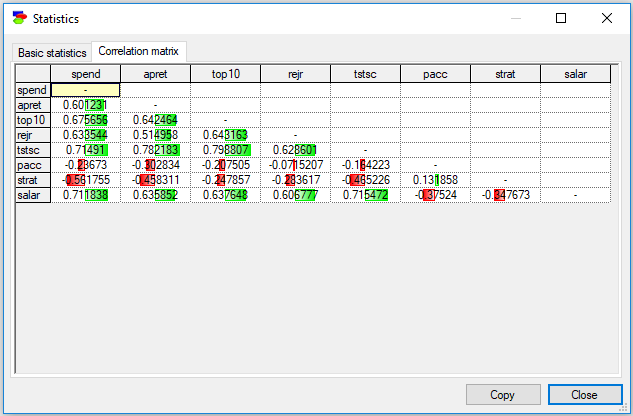
We can see that there are fairly strong correlations between the variables tstsc, top10, salar and apret, which suggests that tstsc, top10, and salar may be good predictors of apret (focus of learning in this data set).
Strengths of connections in Naive Bayes
A simple way of checking the strengths of connections between a class variable and other variables in the data set is building a naive Bayes model with the class variable being the class variable in naive Bayes. Building such model is fairly simple and quick. For example, a naive Bayes model built from the credit.csv data set (included among the examples in GeNIe distribution) will look as follows
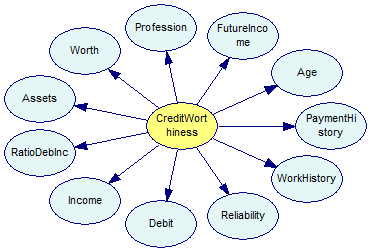
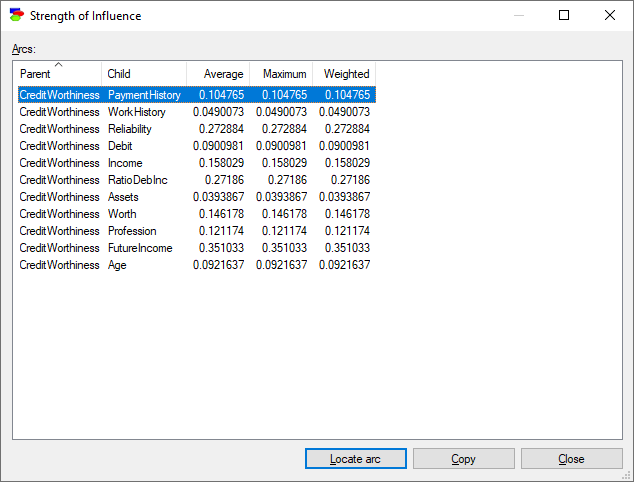
When we press the Strength of influence (![]() ) button, we obtain the following picture
) button, we obtain the following picture
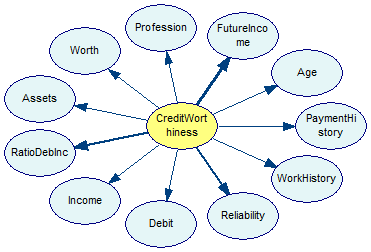
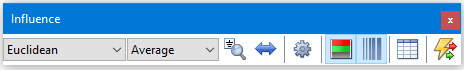
We can see by the thickness of arcs that the variables FutureIncome, RatoDebInc and Reliability have the strongest connections with the class variable CreditWorthiness and are good candidates for important features. It is even better to look at the table of strengths of influences for the model (for that, please press the Show arc list ![]() button the floating Influence toolbar)
button the floating Influence toolbar)
The following table will show
Click on the Maximum header to sort the table entries from the highest maximum influence to the lowest
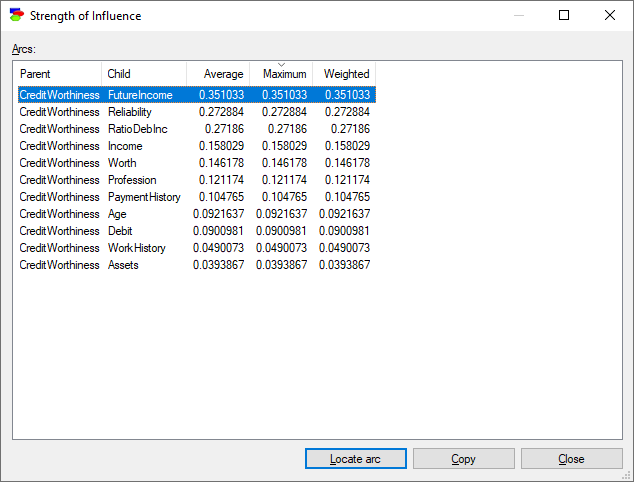
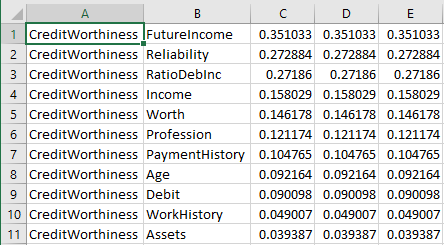
The table now shows us the strongest connections along with their strength. Pressing the Copy button copies the table to the clipboard and allows us to paste it in a program like Excel
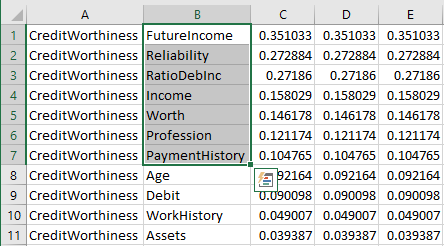
Selecting all variables that have strength of influence larger than, say, 0.10, allows us to paste the list to the learning window of any algorithm and to use only these variables in learning.
Markov blanket variables in structure learning algorithms
Finally, it is possible to identify the most important features by running several structure learning algorithms and constructing a set sum of those variables that the algorithms indicate as being in the Markov blanket of the class variable(s). Suppose we run the Greedy Thick Thinning algorithm on the data set. Greedy Thick Thinning is very fast and it produces reasonable quality results.
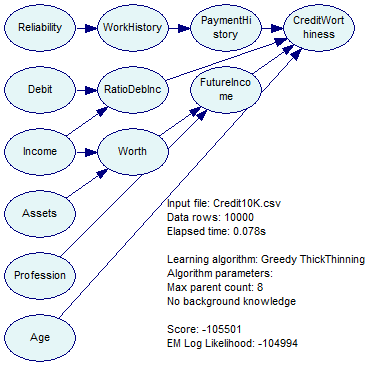
Selecting the class variable (CreditWorthiness) and then Show Connections from the Node menu or the Node Context menu yields
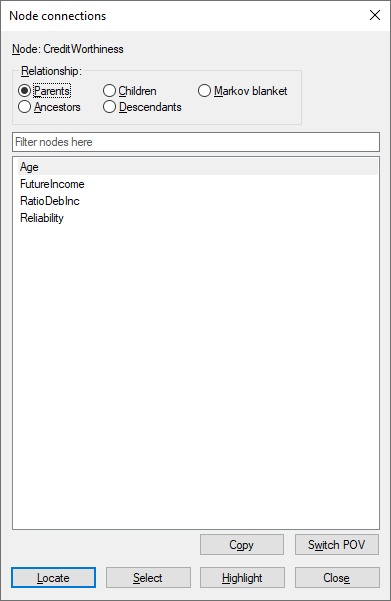
Pressing on the Markov blanket button and then Copy puts the list of the nodes in the Markov blanket of the clipboard. In addition, we can press on the Highlight button, which will highlight the Markov blanket of the class node in the Graph View.
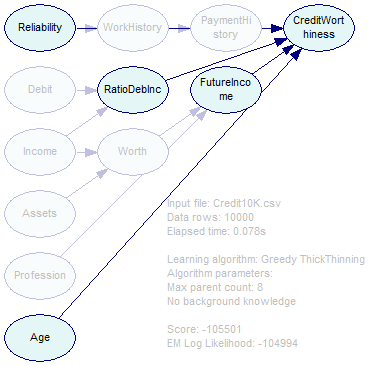
Those nodes directly connected to the class variables are the most likely to include important features. Because the output of various structure learning algorithms may differ, we advise running several of them and then finding a superset of the obtained lists of nodes. A piece of advice for the PC algorithm: Because the algorithm often produces dense networks, we suggest a very low Significance Threshold, perhaps on the order of 0.000001 or even lower (this may depend on the number of records in the data set - if the number of records is small, one can afford a larger threshold).