Node properties sheets allow for modifying properties of model nodes. They can be opened right clicking on the name of the node in the Tree View or right clicking on the icon of the node in the Graph View. This will display the Node Pop-up menu. Select Node Properties from the menu.
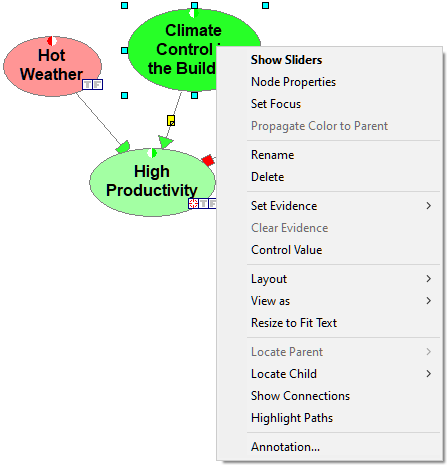
The Node properties consist of two tabs: General tab and Value tab.
General tab
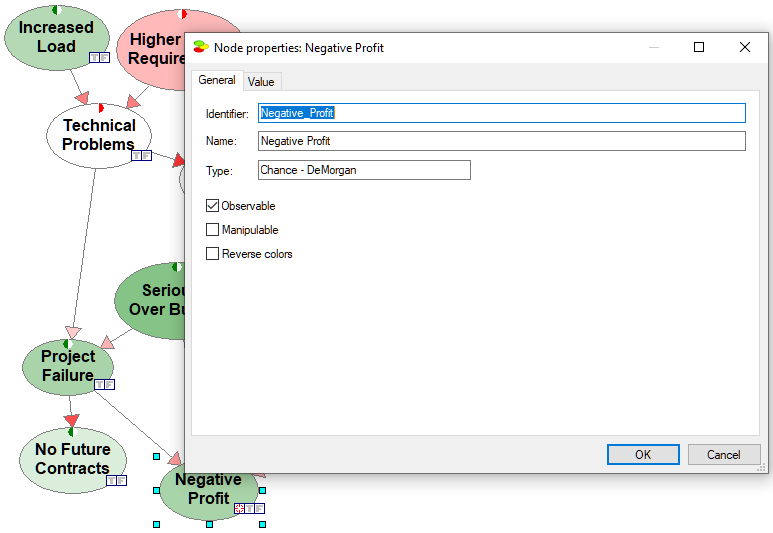
The following image shot shows a snapshot of the General tab:
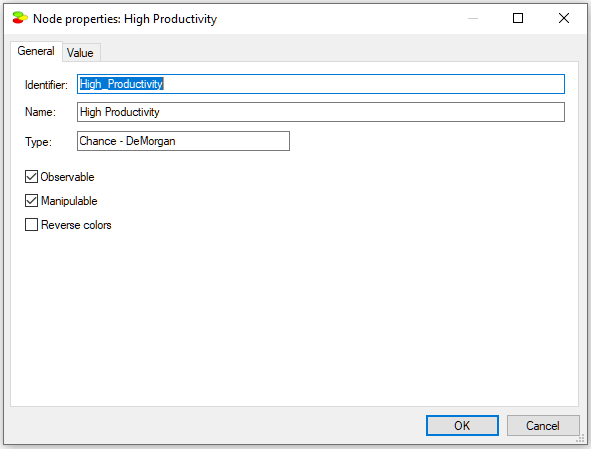
The General tab contains the following properties:
Identifier displays the identifier for the node, which is user-specified. Identifiers must start with a letter, and can contain letters, digits, and underscore (_) characters. The identifier for the network shown above is High_Productivity.
Name displays the name for the network, which is user-specified. There are no limitations on the characters that can be part of the name. The name for the network shown above is High Productivity.
Identifiers, which are meant to refer to nodes, may be too cryptic when working with a model, so we advise that QGeNIe users rely only on Names. The reason for having both, the Identifier and the Name is historical and has to do with the fact that nodes may be referred to in equations. In that case, the reference should avoid problems with parsing, which could easily appear with spaces or special characters. QGeNIe allows for creating and editing identifiers because it is common that QGeNIe models are exported to GeNIe, where identifiers become important.
Node Type (in the picture, it is Chance - DeMorgan) cannot be changed in the General tab and serves only informational purpose. Node type is set during node creation.
Value tab
The Value tab shows the marginal probability distribution over the two states of a QGeNIe node: True and False.
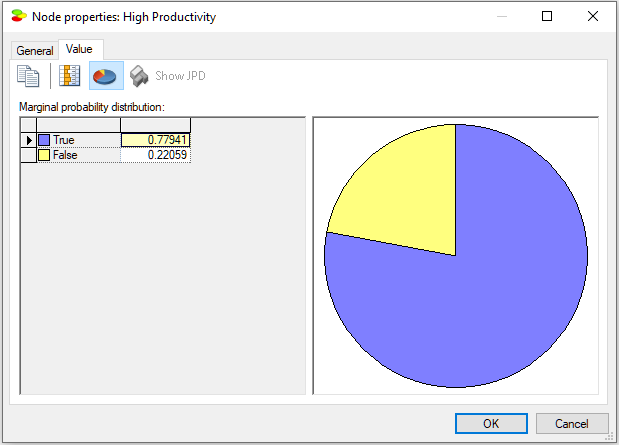
The Piechart (![]() ) button turns on and off the display of this probability distribution as a pie chart. The Show QuickBars (
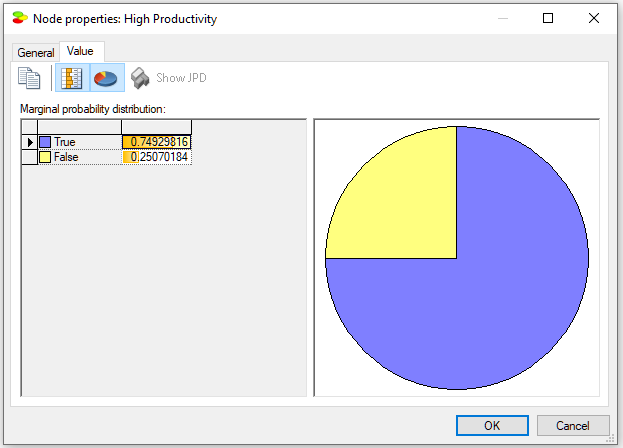
) button turns on and off the display of this probability distribution as a pie chart. The Show QuickBars (![]() ) buttons turns on and off graphical bars in the result spreadsheet (a list of states with their posterior probabilities).
) buttons turns on and off graphical bars in the result spreadsheet (a list of states with their posterior probabilities).
Transparent mode
By default, the node property sheets are displayed in opaque mode, i.e., when open, they cover whatever is under them. Here is a screen shot of the Project model
It is possible to make the property sheets transparent, which may be handy when navigating through a model. Transparent mode allows to see what is under the property sheets. The same model in transparent mode looks as follows
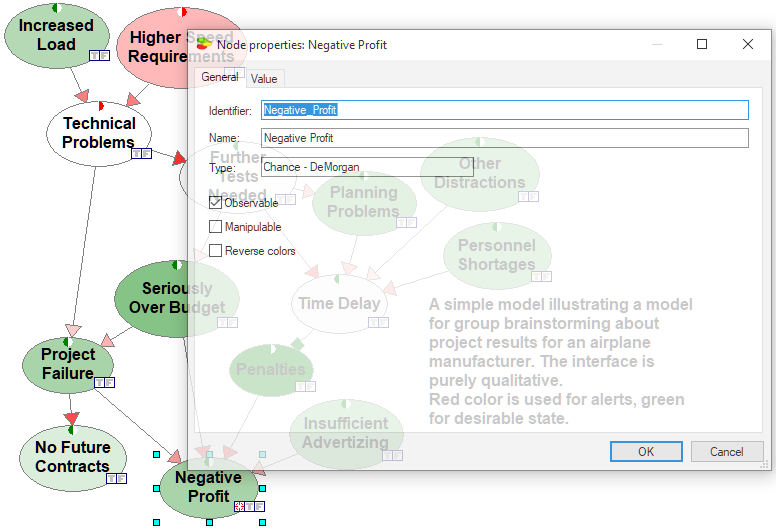
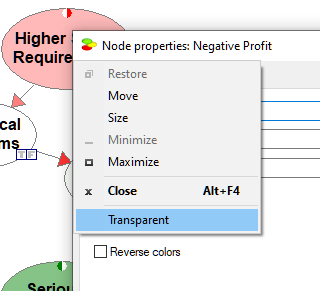
To toggle between the opaque and transparent mode, check the Transparent flag in the System Menu, available by clicking on the icon in the upper-left corner of the node property sheets.
The setting hold only for the currently open property sheet and only as long as it is open.
The transparent mode may be especially useful when the property sheets are maximized, in which case it allows to see what else is on the screen and in the Graph View window.