Network properties sheet summarizes all properties that are specified at the model level. It can be invoked in three ways:
1.Double clicking on a clear area of the network in the graph view.
2.Right clicking on the name of the network in the Tree View or right clicking on a clear area of the network in the Graph View. This will display the Network Pop-up menu. Select Network Properties from the menu.
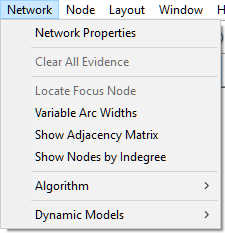
3.Select Network Properties from the Network Menu as shown below.
The Network properties sheet, once opened, consists of several tabs.
General tab
The General tab of Network properties (shown below) consists of the following fields:
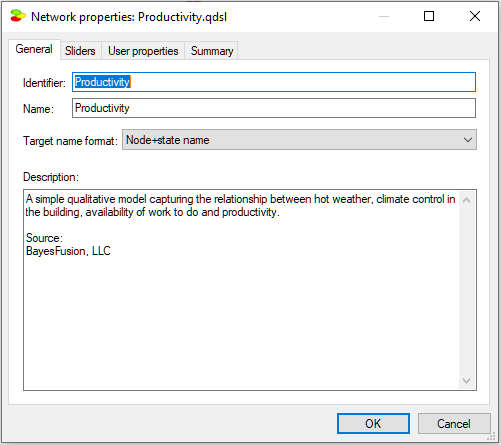
Identifier displays the identifier for the network, which is user-specified. Identifiers must start with a letter, and can contain letters, digits, and underscore (_) characters. The identifier for the network shown above is Productivity.
Name displays the name for the network, which is also user-specified. There are no limitations on the characters that can be part of the name. The name for the network shown above is also Productivity.
Description is a free text describing the network. Please note that a model is a documentation of the problem and use descriptions generously.
Sliders tab
The Sliders tab of Network properties (shown below) allows for choosing the colors representing various degrees of belief in the propositions represented by model variables.
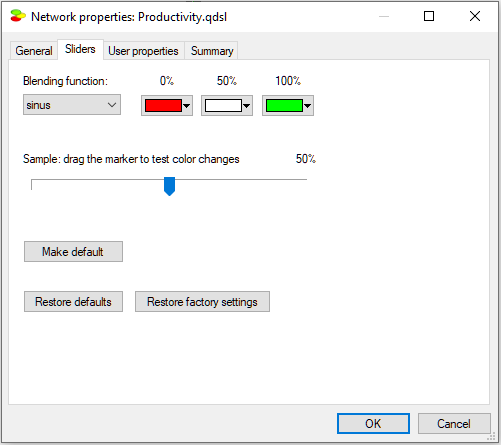
The default colors, which we recommend, range from deep red to deep green, representing probability zero and one respectively. Should you change them and later realize that you would prefer to return to the original settings, you can always use the Restore defaults to return to thecolors defined by previous pressing of the Make default button or Restore factory settings to return to the red-green scheme built into the program. Color transitions can be selected through the Blending function pop-up menu:

User properties tab
User properties tab allows the user to define properties of the model that can be later retrieved by an application program using SMILE.
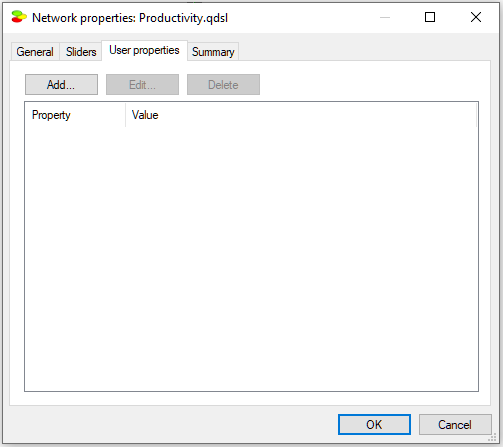
For example, we can add a property AUTHOR with the value "http://www.bayesfusion.com/". Neither QGeNIe nor SMILE use these properties and they provide only placeholders for them. They are under full control and responsibility of the user and/or the application program using the model. QGeNIe and SMILE support only editing and storing/retrieving them.
Button Add invokes the following dialog that allows for defining a new user property:
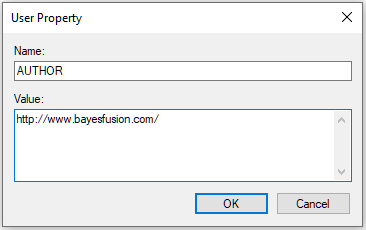
Buttons Edit and Delete allow for editing and removing a selected property, respectively.
Summary tab
Summary tab contains summery statistics of the network, as illustrated below:
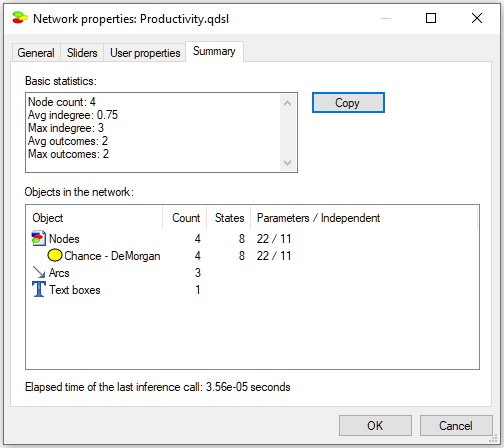
Statistics focus on the structural properties of the network, such as the number of nodes of each type in the network, the average and the maximum in-degree (the number of parents of a node), the average and the maximum number of outcomes of nodes, node counts by their diagnostic type, the number of arcs and the number of text boxes, and, finally, the number of states and parameters. Independent parameters take into account that some parameters are just complements, making sure that probabilities have to add up to 1.0. The Productivity model, shown in all illustrations in this section, contains 4 nodes, all of which are DeMorgan nodes. The number of arcs (3) and the average in-degree (0.75) give an idea of the structural complexity of the network. Elapsed time of the last inference call gives an idea of the difficulty that your computer system experienced with solving the model.