We review in this section two important aspects of viewing nodes in the Graph View.
Icons and bar charts
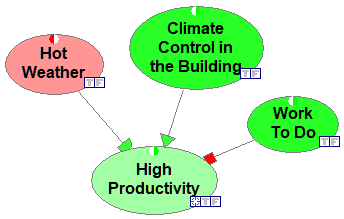
There are two ways of viewing nodes in the Graph View: (1) as icons, and (2) as bar charts. The following image shows the Productivity network from the Hello QGeNIe! section, in which every node is shown as an icon:
The following image shows the same network, in which every node is shown as a bar chart:
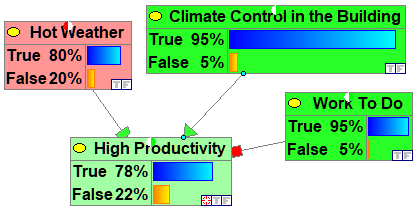
Bar charts display graphically the node's marginal probability distributions. The advantage of seeing a node as a bar chart is that we can see at any point in time its marginal probability distribution expressed by bars and percentages. The disadvantage is that a bar chart takes more space on the screen and may unnecessarily draw user's attention. We advise that those nodes, whose marginal probability distributions are of interest, are viewed as bar charts and others as icons. To switch between the two view, select the nodes in question and use the Node Pop-up menu
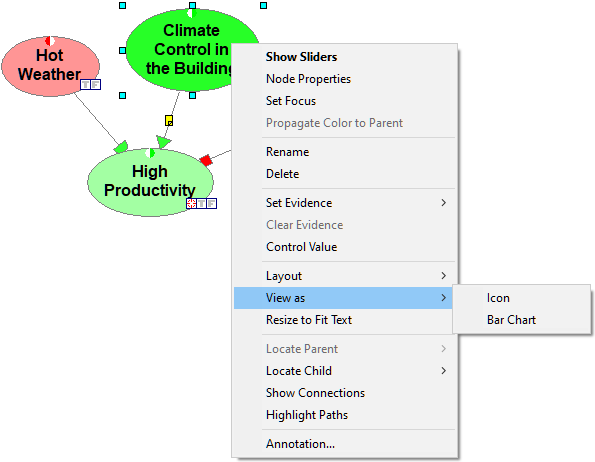
To view all nodes as bar charts or as icons, perform this operation when no nodes are selected.
Names and identifiers
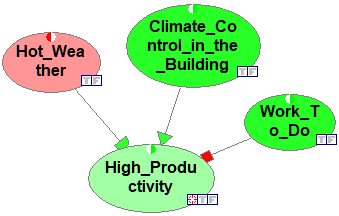
There is another important element of viewing nodes: Viewing their IDs or their names. IDs are short and play the role of variable names. QGeNIe uses them for the purpose of compatibility with GeNIe, and GeNIe, in turn, uses them for the sake of compatibility with equation-based variables, where reference to other nodes in a node's definition has to be through a unique identifier. Identifiers have to start with a letter followed by any combination of letters, digits, and underscore characters. Names are longer and have no limitations on the characters that they are composed of. A model viewed with identifiers looks cryptic.
A model viewed with names is more digestible to human users.
To switch between IDs and names, please use the View Menu
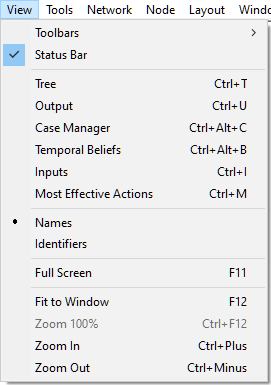
We advise that, unless there are important reasons for viewing them as identifiers, nodes be viewed by names. This is more readable for human users.