The Status Bar is a horizontal bar located at the very bottom of the main GeNIe window. The Status Bar shows a short description of the command to be executed by the selected menu item or a tool on a toolbar on the left side and lists the number of objects currently selected, the number of evidence and target nodes present in the network on the right side.
![]()
The number of selected objects is useful in some operations. For example, we might want to select the Markov blanket of a node through the Show Connections dialog and then subsequently verify its size by glancing at the Status Bar.
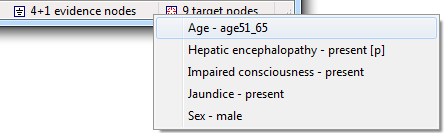
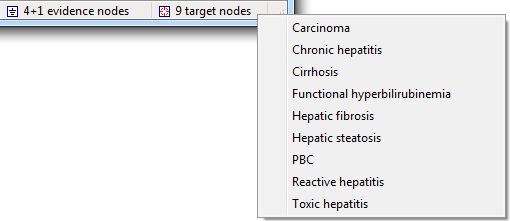
If there are any evidence or target nodes (see Relevance reasoning section for how target nodes are used) set in the network, and any of the observed evidence propagates to other nodes, it will be indicated in the Status Bar as shown in the figure above. The text on the Status Bar 4+1 evidence nodes indicates that there are four observations and one propagated evidence (i.e., evidence implied by the observations). There are nine target nodes in the current network. The list of evidence nodes can be displayed by right-clicking on the text:
So can the list of target nodes:
Any propagated evidence will be listed with a suffix [p]. To display only real evidence, right-click on the Status Bar when holding CTRL key. To display only propagated evidence, right-click on the Status Bar when holding the SHIFT key. Clicking a node name on the list of evidence or target nodes will locate the node in the Graph View.
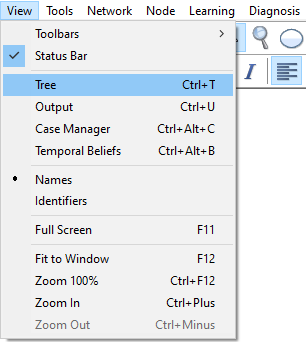
Status Bar can be switched on and off by selecting or deselecting the Status Bar option from the View Menu. A check mark appears next to the menu item when the Status Bar is displayed.