Choosing the right probability distribution over continuous data is a skill that requires some statistical insight. When the distribution is transformed by an equation expression, the task is daunting even for an experienced decision analyst. GeNIe offers an interactive tool for visualizing expressions with probability distributions through Monte Carlo simulation. This helps with selecting an expression that is most appropriate for a task at hand. To invoke the Distribution visualizer, please select it from the Tools menu.
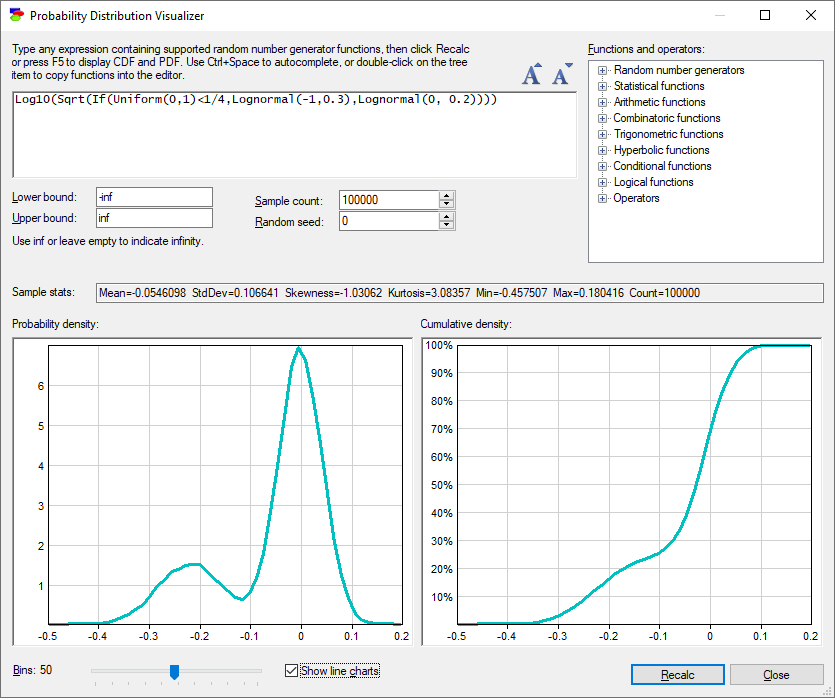
The initial dialog contains a default distribution, Log10(Sqrt(If(Uniform(0,1)<1/4,Lognormal(-1,0.3),Lognormal(0, 0.2)))) plotted in the interval running from minus infinity to infinity based on 10,000 samples. There is nothing magical in this example distribution - it is one of infinitely many hard to visualize distributions that is a decimal logarithm of a mixture of two Lognormal distributions.
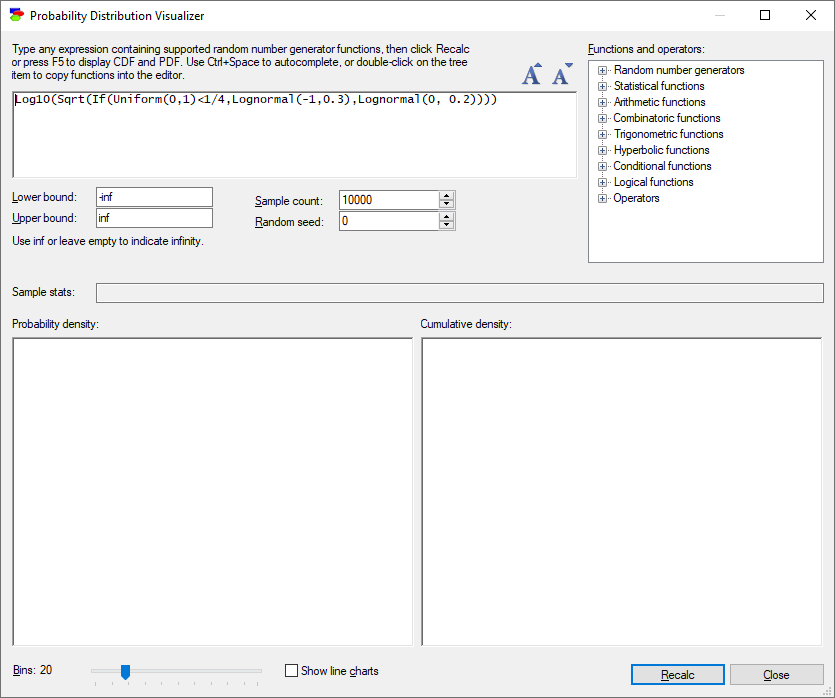
Each of the parameters of this dialog can be modified. Let us, however, start with the default values and press the Recalc button. This shows the probability density function (PDF) and cumulative density function (CDF) of the distribution.
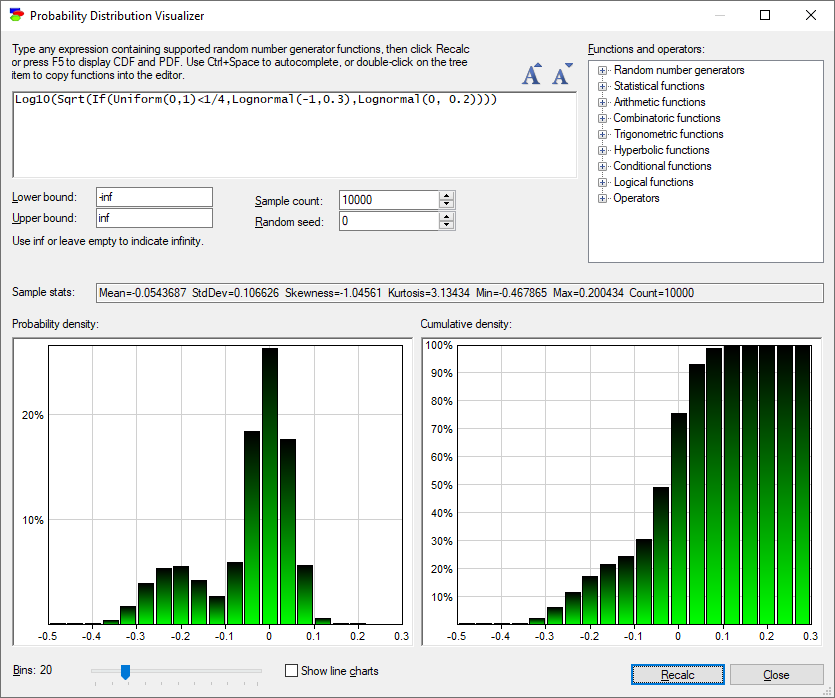
Two easy ways of obtaining more insight into the distribution is by (1) increasing the number of samples, and (2) increasing the number of bins of the histogram that shows the samples. In the following dialog, we changed the number of samples to 100,000 and the number of bins to 50.
By checking the Show line charts check box, it is possible to view the plot as the PDF and the CDF charts fitted to the histograms.
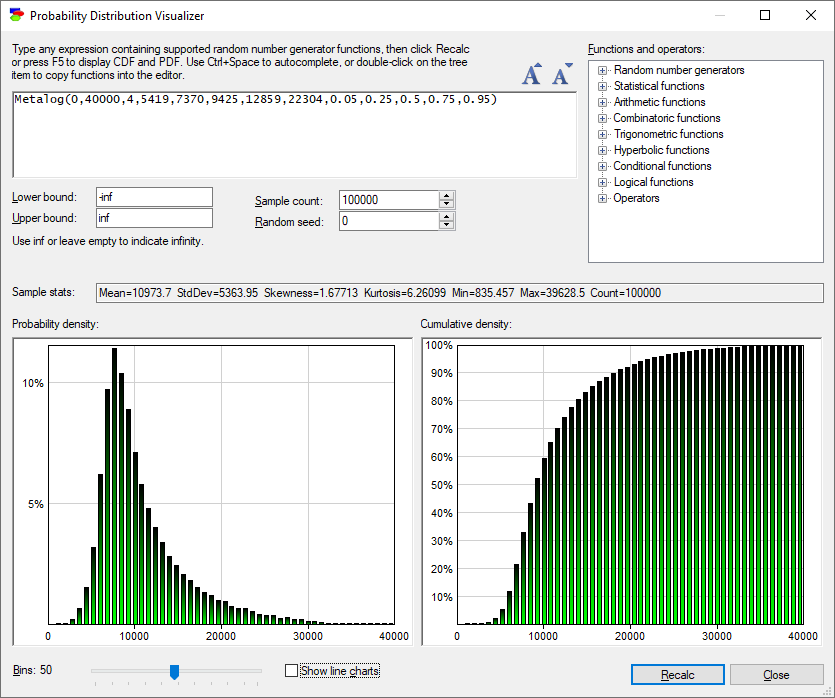
The expression dialog serves for defining the expression to be visualized. Entering a definition of a metalog distribution and pressing the Recalc button leads to the following plots.
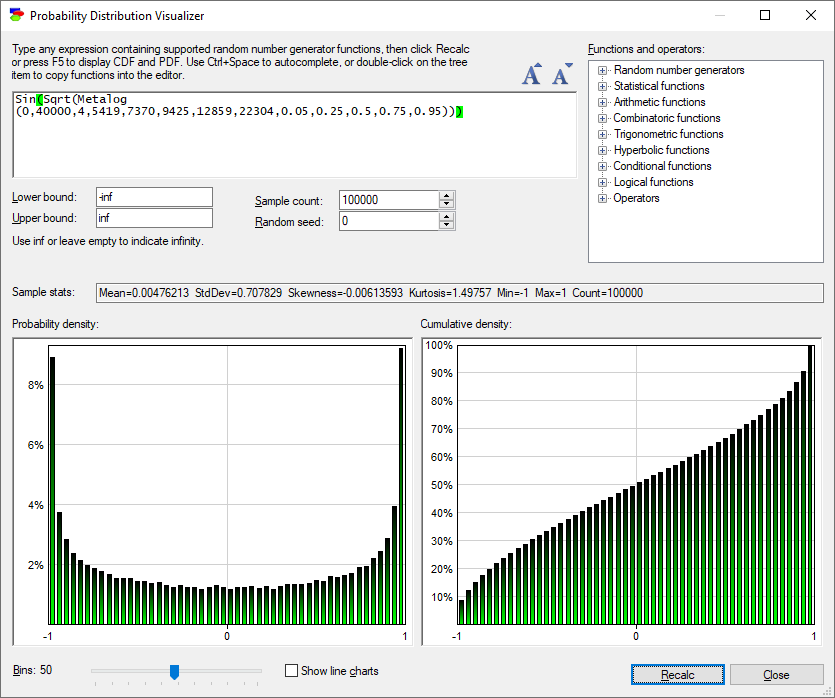
We can examine what the sinus of the square root of this distribution will look like. In fact any function and any operator from those functions and operators that are known to GeNIe and displayed in the upper-right window pane can be used in the expression. If the Distribution visualizer is invoked in the context of a model, custom functions defined within the model will also become available.
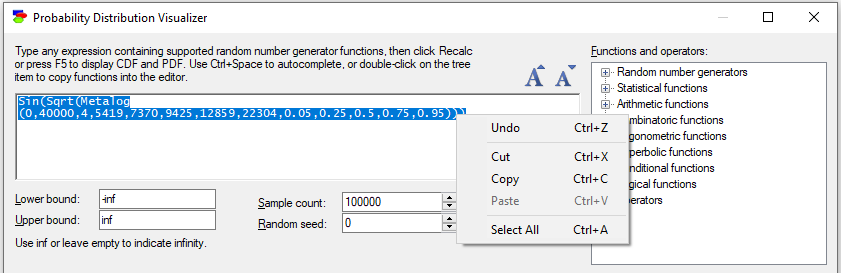
Once we have converged on a satisfactory expression, we can select and copy the expression so that we can later paste it into the definition of a variable in our model.
It should be added that any histogram or distribution plot in the Distribution visualizer can be copied and later pasted as a picture into any other Windows application by right-clicking on the histogram/plot and choosing Copy.
Please note that we made the functionality of Distribution visualizer available to the community through a web interface at https://prob.bayesfusion.com/.