Strange behavior of TruncNormal

The front end.
Post Reply
PCherubini
Posts: 26
Joined: Thu Mar 24, 2022 9:00 am

Strange behavior of TruncNormal

Post by PCherubini »

Hi,
There's some behavior of the TruncNormal distribution that I do not understand. In the attached example net, v1 is bounded {0, 10} in 10 steps. Error is TruncNormal(0,1,-2,2), further bounded {-2,2}, and discretized in 4 states. v2 = v1 + error, but it is bounded {0,10}. With the selected option "reject out of bounds samples" in the network properties, it works well in forward mode, e.g:
Screenshot 2024-02-27 alle 15.00.38.png
Screenshot 2024-02-27 alle 15.00.38.png (84.29 KiB) Viewed 687 times
But in knowledge revision mode, it gives non-zero values to v1 states that are incompatible with the v2 value, e.g. non-zero prob to v1=0 and v1=10 for v2=5.5:
Screenshot 2024-02-27 alle 15.03.00.png
Screenshot 2024-02-27 alle 15.03.00.png (63.83 KiB) Viewed 687 times
That's a bit of a problem for some models that I'm building. How can I solve that?
Thx!
Attachments
example TruncNormal.xdsl
(2.52 KiB) Downloaded 44 times
marek [BayesFusion]
Site Admin
Posts: 430
Joined: Tue Dec 11, 2007 4:24 pm

Re: Strange behavior of TruncNormal

Post by marek [BayesFusion] »

I have looked at your model and I believe that this is a theoretical problem that is solvable at the modeling stage. Please note that the domain of v2 is {0,10} and when you have a combination of {0,1} at v1 and {-2,-1} at error, you generate a value for v2 that is out of bounds. This is handled easily in forward inference (the sample is just rejected) but there is no way of handling it correctly at the discretization phase in v2. Please note that GeNIe generates discretization warnings of the type "Discretization problem in node v2: Underflow samples: 19825, min=-1.99038 loBound=0 Overflow samples: 20027, max=11.9943 hiBound=10 Total valid samples: 360148 of 400000 CPT configs with no valid samples: 2 of 40". Essentially, for the case of {0,1} at v1 and {-2,-1} at error, the sample generated cannot be used in determining the probability distribution over v2. Effectively, GeNIe does something that is normally reasonable, i.e., with no single sample generated for that case, it assumes a uniform distribution. This causes the non-zero values at {0,1} and {9,10} at v1 for evidence at v2=5.5.

A simple solution that I applied in v2 is extending the domain to {-2,12}. In this model, the distributions are all created correctly. Please see the attached model and check if it performs as you expected. I have made a few small corrections that should make the model more readable/useful for you. When you use numerical discrete nodes, I would use "Intervals" rather "Identifiers and intervals" -- this way the meanigless "State0" etc. labels disappear. I would also use empty labels in the discretization of numerical nodes (error and v2). This forces GeNIe to display ranges, also more useful than meaningless labels.

I hope this helps,

Marek
Attachments
example TruncNormal M.xdsl
(2.14 KiB) Downloaded 44 times
PCherubini
Posts: 26
Joined: Thu Mar 24, 2022 9:00 am

Re: Strange behavior of TruncNormal

Post by PCherubini »

Thank you for your reply and the useful suggestions! (I never discovered by myself the trick of the empty labels :-) )

The problem is theoretical, as you say, but very practical in some applied fields (but I'll leave the practical example to a later post in order to stay focused on the technical problem in this one). Your solution of widening the domain of v2 is of course viable for backward revision, but it allows forward inferences outside the real boundaries of v2:
Screenshot 2024-02-28 alle 09.30.21.png
Screenshot 2024-02-28 alle 09.30.21.png (109.5 KiB) Viewed 676 times
What makes me suspect that you might solve radically the problem of backward revision of truncnormal distributions at the algorithm level is that the solution that I provisionally adopted, namely re-defining the boundaries of v2 by using conditional operators, works both backwards and forward. In the abstract example in the attached network the definition of v2 is: v2=If(v1+error<0,0,If(v1+error>10,10,v1+error)). It cumulates all the probability masses beyond 10 and below 0 on the {9,10} and {0,1} states of v1, and does not cause problems neither in forward nor in backward inference (apart from the strange 0% prob of {-2,-1} errors in the backward example, that I'm still striving to understand):
Screenshot 2024-02-28 alle 09.41.46.png
Screenshot 2024-02-28 alle 09.41.46.png (102.75 KiB) Viewed 676 times
Screenshot 2024-02-28 alle 09.42.06.png
Screenshot 2024-02-28 alle 09.42.06.png (91.04 KiB) Viewed 676 times
Do you think that it is correct/advisable/feasible that the algorithm implementing boundaries in truncnormal (or else boundaries at the node level) is modified in a similar way? A careful user can notice these problems and solve them at the modeling stage, but I fear that not everyone of my young students of evidential reasoning (by the way, I'll never thank you guys enough for keeping free the academic version of GeNIe... otherwise I couldn't do the course) is so careful, and they might "trust" the boundaries of the distribution without noticing that the out-of-bounds samples are uniformly redistributed on "impossible" states.
PCherubini
Posts: 26
Joined: Thu Mar 24, 2022 9:00 am

Re: Strange behavior of TruncNormal

Post by PCherubini »

The model is here (the replies do not accept more than three images/attachments):
example TruncNormal MP.xdsl
(2.3 KiB) Downloaded 62 times
PCherubini
Posts: 26
Joined: Thu Mar 24, 2022 9:00 am

Re: Strange behavior of TruncNormal

Post by PCherubini »

This is for contextualising the theoretical problem only. It is a small fragment (the complete case has some more clues) of an old italian murder case that I use as an example in class. Bare data for the fragment:
1) a victim V is murdered (by stabbing) in her house and is found - more or less - three days after the murder (d+3)
2) she was certainly still alive at 17:00 of d
3) the suspect and then indicted person S was certainly with her from 17:00 to 19:00, and certainly left at 19:00 and never returned
4) no one else was with the victim from 17 to 19; so if the actual time of death is from 17 to 19 of d, S is necessarily the murderer; if the actual time of death is after 19, S is necessarily innocent. The priors of S being guilty are irrelevant for this exercise, so they are left at 50%
5) the first evaluation by the coroner, translating his own words into numbers, is: mean 22:30, s.d. 1.25 (assume normality, but truncated at 17:00 of d, and at noon of d+1; the error node has mean 0, and is truncated at -5 +5 to avoid implausibly long tails)
6) later (in appeal after S was acquitted in the first trial) the coroner revised his testimony to: mean 18.30, s.d. 0.75 (error truncated at -3 +3) (S was convicted, in appeal, and spent quite a few years in prison).
The uncorrected version of the model ("practical example without ifs", in attachment) leaves residual probabilities around noon d+1, that of course increase inappropriately the probability of "Indicted not guilty". You can check with alternative counterfactual scenarios where the coroner says different times, e.g. he says "midnight" twice, and verify that residual probabilities cumulate also on 17-18, increasing inappropriately the probability of "indicted guilty" in that scenario. The corrected version ("practical example bounded by ifs") cut those residual probabilities by using conditional operators. Eg the definition of the node coroner_estimate_1 is: Coroner_estimate_1=If(Time_of_death+Error_estimate_1<17,17,If(Time_of_death+Error_estimate_1>37,37,Time_of_death+Error_estimate_1))
Attachments
practical example bounded with ifs.xdsl
(6.24 KiB) Downloaded 44 times
practical example without ifs.xdsl
(6.07 KiB) Downloaded 43 times
marek [BayesFusion]
Site Admin
Posts: 430
Joined: Tue Dec 11, 2007 4:24 pm

Re: Strange behavior of TruncNormal

Post by marek [BayesFusion] »

You are proposing an interesting solution that will work well in many case, certainly in this case. Let us look at the simplified model with just three variables. We do get funny (in terms of being large) number of samples in forward inference for small and large values of evidence in v1 (e.g., 0..1, 1..2, 8..9, and 9..10 :-). How will you explain that to the user? Of course, we could modify the discretization algorithm to contain a formula like yours but then the user might wonder why the large number of samples there. The current solution (and my proposed model) make you think carefully about the domains of your variables. I agree that the samples in the range of -2..0 and 10..12 are odd but this is the consequence of the distributions/definitions used in v1 and error. Do you have a strong feeling which is better/more intuitive?
Cheers,

Marek
PCherubini
Posts: 26
Joined: Thu Mar 24, 2022 9:00 am

Re: Strange behavior of TruncNormal

Post by PCherubini »

We do get funny (in terms of being large) number of samples in forward inference for small and large values of evidence in v1 (e.g., 0..1, 1..2, 8..9, and 9..10 :-).

:-) Where can you see the number of samples that are generated? In my GeNIe the output windows report them only when there are some invalid samples.
However, I imagine that since all the <0 and >10 samples are rejected and regenerated, the number might be huge, but if I put the equivalent function
If(Uniform(0,10)+TruncNormal(0,1,-2,2)<0,0,If(Uniform(0,10)+TruncNormal(0,1,-2,2)>10,10,Uniform(0,10)+TruncNormal(0,1,-2,2)))
inside the distribution visualizer, it generates it within the standard 10000 samples
Screenshot 2024-03-06 alle 14.05.51.png
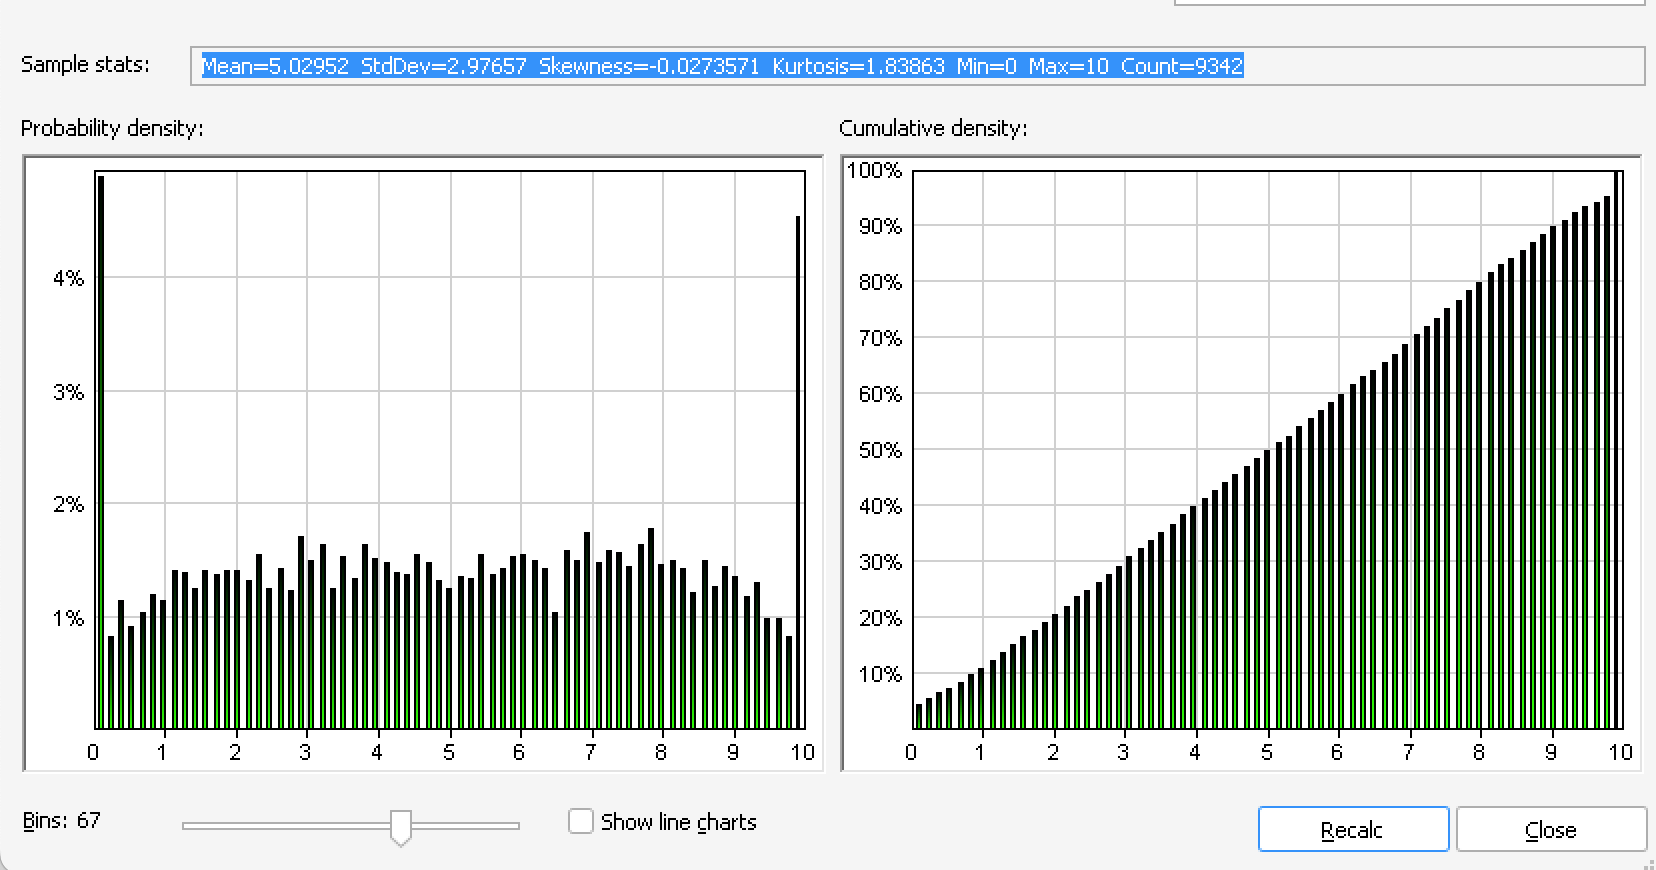
Screenshot 2024-03-06 alle 14.05.51.png (189.95 KiB) Viewed 419 times
I've no strong feelings about which solution might be more intuitive, and I think that your solution is algorithmically more efficient, but possibly when you revise the guide put a sentence explaining that if the models intrinsically allows the generation of out of bounds values for truncated distributions, then those values are uniformly distributed over the most extreme "impossible" values of the distribution (if this is really how it works). It might avoid some errors in some applications. Thank you for you patience and suggestions!
Screenshot 2024-03-06 alle 14.19.39.png
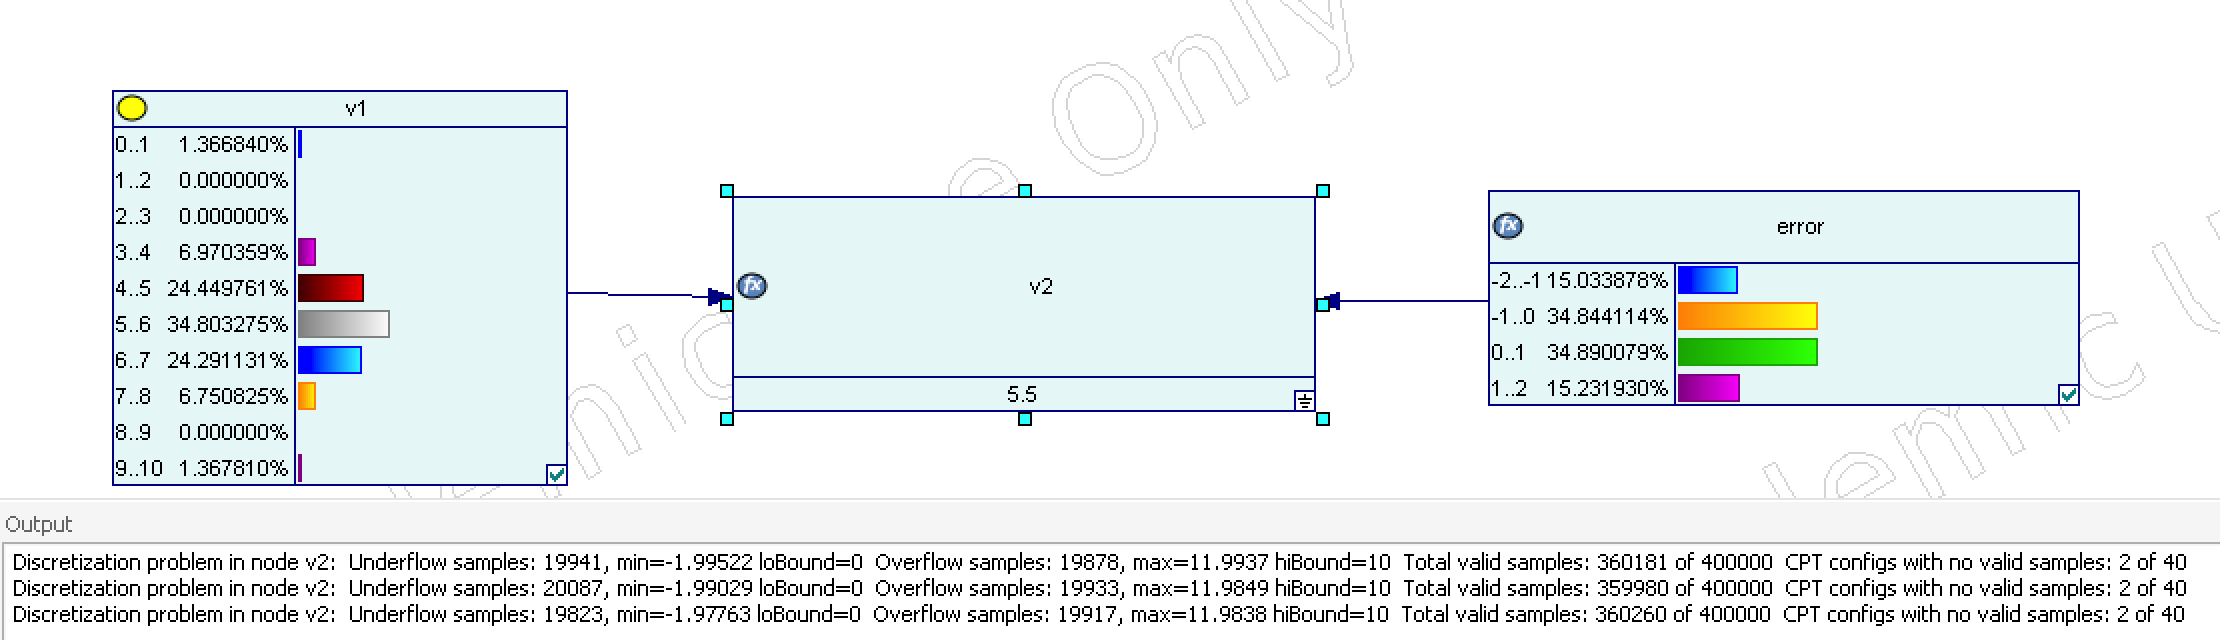
Screenshot 2024-03-06 alle 14.19.39.png (97.24 KiB) Viewed 419 times
marek [BayesFusion]
Site Admin
Posts: 430
Joined: Tue Dec 11, 2007 4:24 pm

Re: Strange behavior of TruncNormal

Post by marek [BayesFusion] »

In GeNIe, you can see all samples generated on the left hand side in the Value tab. GeNIe displays the number of samples generated for any bar in the histogram when you hover over that bar. Distribution visualizer has the same functionality.

We will extend the description in the manual to account for the problem that you have identified. I feel inclined to leave the algorithm as it is but not for efficiency reason (we rarely give this the highest priority -- SMILE is very efficient anyway -- user interface and user convenience are much more important. In this case, as you have shown in your left picture, the high number of samples of zero and 10 is surprising and not really what the user might have intended. This is the main reason why I prefer the current solution.
Cheers,

Marek
Post Reply