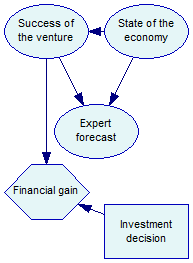
We will further expand the model created in Tutorial 1 and turn it into an influence diagram. To this effect, we will add a decision node Investment decision and a utility node Financial gain. The decision will have two possible states: Invest and DoNotInvest, which will be the two decision options under consideration. Which option is chosen will impact the financial gain and this will be reflected by a directed arc from Investment decision to Financial gain. Whether the venture succeeds of fails will also impact the financial gain and this will be also reflected by a directed arc from Success of the venture to Financial gain.
We will show how to create this model. In the subsequent tutorial, we will show how to enter observations (evidence), how to perform inference, and how to retrieve the utilities calculated for the Financial gain node.
The programs starts by reading the file, just like Tutorial 2 and Tutorial 3. We convert the identfier of the node Success to node handle, which we will use later to create an arc between Success and Gain. Two new nodes will be created by calling a createNode helper function, which is slightly modified version of the createCptNode from Tutorial 1. The difference is that we now want to create different types of nodes. Therefore, createNode has one additional input parameter, an integer which specifies the node type. Another difference is that createNode needs to be able to add utility nodes, which do not have outcomes. The function checks for the value of its outcomes input parameter and if it is null, the outcome initialization is skipped.
createNode is called to add two new nodes:
•a decision node Investment , with a Network.NodeType.DECISION type identifier
•an utility node Gain, with a Network.NodeType.UTILITY type identifier
With new nodes created we connect them to the rest of the model with Network.addArc. The only thing left is the initialization of the parameters for the Gain node (Invest is a decision node and decision nodes have no numeric parameters). Gain has two parents with two outcomes each and size of its definition is 2 x 2 x 1 = 4. The program therefore specifies four numbers for the utilities.
Python:
gain_definition = [
10000, # Utility(Invest=I, Success=S)
-5000, # Utility(Invest=I, Success=F)
500, # Utility(Invest=D, Success=S)
500 # Utility(Invest=D, Success=F)
]
net.set_node_definition(g, gain_definition)
Java:
double[] gainDefinition = new double[] {
10000, // Utility(Invest=I, Success=S)
-5000, // Utility(Invest=I, Success=F)
500, // Utility(Invest=D, Success=S)
500 // Utility(Invest=D, Success=F)
};
net.setNodeDefinition(g, gainDefinition);
C#:
double[] gainDefinition = new double[]
{
10000, // Utility(Invest=I, Success=S)
-5000, // Utility(Invest=I, Success=F)
500, // Utility(Invest=D, Success=S)
500 // Utility(Invest=D, Success=F)
};
net.SetNodeDefinition(g, gainDefinition);
R:
gainDefinition <- c(10000, # Utility(Invest=I, Success=S)
-5000, # Utility(Invest=I, Success=F)
500, # Utility(Invest=D, Success=S)
500) # Utility(Invest=D, Success=F)
net$setNodeDefinition(g, gainDefinition)
The influence diagram is now complete, so we can write its contents to the file and exit the function. Tutorial 5 will load the file and perform the inference.