The program in this section uses one of the example discrete networks distributed in GeNIe, which can be downloaded directly using the following link: https://support.bayesfusion.com/docs/Examples/Discrete%20Bayesian%20Networks/HeparII.xdsl. The model is also available in BayesFusion's online repository at https://repo.bayesfusion.com/network/permalink?net=Small+BNs%2FHeparII.xdsl.
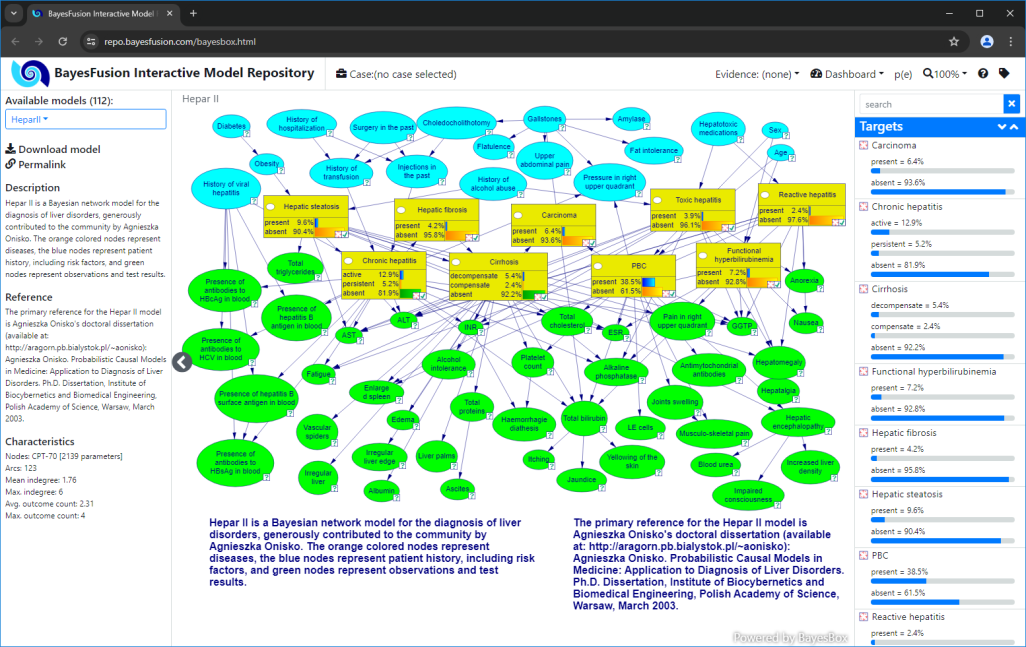
HeparII.xdsl is a Bayesian network model for the diagnosis of liver disorders. It has diagnostic roles defined for its nodes. The model nodes were formatted to use yellow as a background for fault nodes, and green/blue for observation nodes. Note that while binary fault nodes have one fault state (present), there are also two fault nodes with three states. These nodes have two out of three states marked as faulty, like active and persistent in the case of Chronic Hepatitis.
Our program loads the network at startup and calls its helper function printDiagTypes to output the information about diagnostic roles. The first lines of the output look like this:
Node Id Diagnostic Type Fault Outcomes
alcoholism NodeDiagType.OBSERVATION n/a
vh_amn NodeDiagType.OBSERVATION n/a
hepatotoxic NodeDiagType.OBSERVATION n/a
THepatitis NodeDiagType.FAULT ['present']
hospital NodeDiagType.OBSERVATION n/a
surgery NodeDiagType.OBSERVATION n/a
gallstones NodeDiagType.OBSERVATION n/a
choledocholithotomy NodeDiagType.OBSERVATION n/a
injections NodeDiagType.OBSERVATION n/a
transfusion NodeDiagType.OBSERVATION n/a
ChHepatitis NodeDiagType.FAULT ['active', 'persistent']
sex NodeDiagType.OBSERVATION n/a
...
The printDiagTypes function iterates over the nodes in the network. Its main loop calls Network.getNodeDiagType to determine the diagnostic role. If the node is a fault, its outcomes are also inspected using Network.isFaultOutcome.
Python:
diag_type = net.get_node_diag_type(node_id)
fault_outcomes = []
if diag_type == pysmile.NodeDiagType.FAULT:
for outcome_id in net.get_outcome_ids(node_id):
if net.is_fault_outcome(node_id, outcome_id):
fault_outcomes.append(outcome_id)
Java:
int diagType = net.getNodeDiagType(nodeId);
List<String> faultOutcomes = new ArrayList<>();
if (diagType == Network.NodeDiagType.FAULT) {
for (String outcomeId : net.getOutcomeIds(nodeId)) {
if (net.isFaultOutcome(nodeId, outcomeId)) {
faultOutcomes.add(outcomeId);
}
}
}
C#:
Network.NodeDiagType diagType = net.GetNodeDiagType(nodeId);
List<string> faultOutcomes = new List<string>();
if (diagType == Network.NodeDiagType.Fault)
{
foreach (string outcomeId in net.GetOutcomeIds(nodeId))
{
if (net.IsFaultOutcome(nodeId, outcomeId))
{
faultOutcomes.Add(outcomeId);
}
}
}
R:
diagType <- net$getNodeDiagType(nodeId)
faultOutcomes <- character()
if (diagType == net$NodeDiagType$FAULT) {
outcomeIds <- net$getOutcomeIds(nodeId)
for (outcomeId in outcomeIds) {
if (net$isFaultOutcome(nodeId, outcomeId)) {
faultOutcomes <- c(faultOutcomes, outcomeId)
}
}
}
We now proceed to the actual diagnosis: the DiagNetwork object is instantiated. In its constructor, the fault probabilities are calculated and the most likely fault is selected to be pursued. DiagNetwork uses zero-based integer indices to identify faults (node/node outcome pairs). The printFaultIndices helper function iterates over faults. It uses DiagNetwork.getFaultCount, getFaultNodeId and getFaultOutcomeId to emit the following output:
Diagnostic network has 11 faults (node/outcome pairs)
Fault Index Fault Node Id Fault Outcome Id
0 THepatitis present
1 ChHepatitis active
2 ChHepatitis persistent
3 PBC present
4 fibrosis present
5 Steatosis present
6 Cirrhosis decompensate
7 Cirrhosis compensate
8 Hyperbilirubinemia present
9 RHepatitis present
10 carcinoma present
We can read the index of the currently pursued fault with DiagNetwork.getPursuedFault. Initially, the most likely fault is at index 3, which represents the node PBC and its outcome present.
Python:
pursued_fault_idx = diag.get_pursued_fault()
print(f"The default (most likely) pursued fault is at index {pursued_fault_idx}: "
+ f"{diag.get_fault_node_id(pursued_fault_idx)}"
+ f"={diag.get_fault_outcome_id(pursued_fault_idx)}")
Java:
int pursuedFaultIdx = diag.getPursuedFault();
System.out.printf("The default (most likely) pursued fault is at index %d: %s=%s\n",
pursuedFaultIdx, diag.getFaultNodeId(pursuedFaultIdx),
diag.getFaultOutcomeId(pursuedFaultIdx));
C#:
int pursuedFaultIdx = diag.GetPursuedFault();
Console.WriteLine("The default (most likely) pursued fault is at index {0}: {1}={2}",
pursuedFaultIdx,
diag.GetFaultNodeId(pursuedFaultIdx), diag.GetFaultOutcomeId(pursuedFaultIdx));
R:
pursuedFaultIdx <- diag$getPursuedFault()
cat(sprintf("The default (most likely) pursued fault is at index %d: %s=%s\n",
pursuedFaultIdx,
diag$getFaultNodeId(pursuedFaultIdx), diag$getFaultOutcomeId(pursuedFaultIdx)))
The program performs the diagnostic update without any observations instantiated. DiagNetwork.update is called, and results are returned as a DiagResults object. The diagnostic results contain two arrays, one for faults, and another for observations. The arrays are sorted: faults are sorted by probability with most likely faults at the top, and observations are sorted by the magnitude of the information gain. Our printDiagResults iterates over the elements of these arrays. printFaultInfo and printObservationInfo are used to access the members of the FaultInfo and ObservationInfo objects, respectively. The first lines of the fault/observation output look like this:
Faults:
Node Id Outcome Id Probability Is Pursued
PBC present 0.41341570632059377 Yes
ChHepatitis active 0.1290048962276199 No
Steatosis present 0.09585221239536176 No
carcinoma present 0.0665709760500613 No
...
Observations:
Node Id Measure Cost InfoGain
ama 0.5576308476489384 0.0 0.5576308476489384
cholesterol 0.4868445142223191 0.0 0.4868445142223191
ESR 0.42960779128083926 0.0 0.42960779128083926
bilirubin 0.41580785350162774 0.0 0.41580785350162774
age -0.33803891617697684 0.0 -0.33803891617697684
skin 0.3100428612068602 0.0 0.3100428612068602
...
The default diagnostic measure algorithm for single fault diagnosis uses the maximum magnitude of probability change in the pursued fault over all outcomes of the observation node. From the output, we can deduce that the ama node has an outcome that causes the probability PBC=present to increase by 0.55763. Note also that age infoGain is negative due to (signed) probability change used as a diagnostic measure algorithm. For brevity, the tutorial program does not use ObservationInfo.outcomeGain array, which contains per-outcome infoGain. From outcomeGain, we could determine which outcome of the ama node is responsible for the maximum change in PBC. Other members of ObservationInfo not displayed by this tutorial are faultPosteriors and observationPriors. The faultPosteriors array contains probabilities of pursued fault after instantiating each outcome of the observation. The observationPriors array contains prior probabilities for each observation outcome.
We will now instantiate (observe) some observation nodes. DiagNetwork.instantiateObservation calls Network.setEvidence internally, and updates DiagNetwork's state. Always call DiagNetwork.instantiateObservation when the diagnostic session is in progress. Calling Network.setEvidence directly may lead to inconsistent results or errors. Our observations are:
•jaundice=present
•nausea=absent
•obesity=present
The code is straightforward:
Python:
diag.instantiate_observation("jaundice", "present")
diag.instantiate_observation("nausea", "absent")
diag.instantiate_observation("obesity", "present")
Java:
diag.instantiateObservation("jaundice", "present");
diag.instantiateObservation("nausea", "absent");
diag.instantiateObservation("obesity", "present");
C#:
diag.InstantiateObservation("jaundice", "present");
diag.InstantiateObservation("nausea", "absent");
diag.InstantiateObservation("obesity", "present");
R:
diag$instantiateObservation("jaundice", "present")
diag$instantiateObservation("nausea", "absent")
diag$instantiateObservation("obesity", "present")
After another call to DiagNetwork.update and printDiagResults, we get the following output:
Faults:
Node Id Outcome Id Probability Is Pursued
PBC present 0.3716679804854865 Yes
Steatosis present 0.20822898960092975 No
ChHepatitis active 0.12911036437662063 No
Cirrhosis decompensate 0.08774271003265043 No
...
Observations:
Node Id Measure Cost InfoGain
ama 0.5940244757037065 0.0 0.5940244757037065
cholesterol 0.4557094807486714 0.0 0.4557094807486714
bilirubin 0.43194679397989816 0.0 0.43194679397989816
ESR 0.41696920311719615 0.0 0.41696920311719615
age -0.3062170075414388 0.0 -0.3062170075414388
skin 0.2869860117172001 0.0 0.2869860117172001
...
With known jaundice, nausea and obesity the fault probabilities and observation infoGains have changed, but the ama node is still our most useful observation.
The next step is to change the outcome of obesity to absent and retract the observation of nausea. We will also switch our pursued fault to Hyperbilirubinemia=present.
Python:
diag.release_observation("nausea")
diag.instantiate_observation("obesity", "absent")
hyperbilirubinemia_idx = diag.get_fault_index("Hyperbilirubinemia", "present")
diag.set_pursued_fault(hyperbilirubinemia_idx)
Java:
diag.releaseObservation("nausea");
diag.instantiateObservation("obesity", "absent");
int hyperbilirubinemiaIdx = diag.getFaultIndex("Hyperbilirubinemia", "present");
diag.setPursuedFault(hyperbilirubinemiaIdx);
C#:
diag.ReleaseObservation("nausea");
diag.InstantiateObservation("obesity", "absent");
int hyperbilirubinemiaIdx = diag.GetFaultIndex("Hyperbilirubinemia", "present");
diag.SetPursuedFault(hyperbilirubinemiaIdx);
R:
diag$releaseObservation("nausea")
diag$instantiateObservation("obesity", "absent")
hyperbilirubinemiaIdx <- diag$getFaultIndex("Hyperbilirubinemia", "present")
diag$setPursuedFault(hyperbilirubinemiaIdx)
Another DiagNetwork.update and printDiagResults calls produce this output:
Node Id Outcome Id Probability Is Pursued
PBC present 0.3699731063429856 No
ChHepatitis active 0.12884438248137664 No
Steatosis present 0.08508721992530559 No
carcinoma present 0.06083429718416463 No
ChHepatitis persistent 0.05272028107403933 No
Hyperbilirubinemia present 0.052337451916630945 Yes
...
Observations:
Node Id Measure Cost InfoGain
age 0.2455407606076575 0.0 0.2455407606076575
hepatomegaly 0.04617967333309004 0.0 0.04617967333309004
bilirubin 0.042062826363683546 0.0 0.042062826363683546
ggtp -0.03279259884194631 0.0 -0.03279259884194631
ESR -0.024267251569646417 0.0 -0.024267251569646417
ama -0.023463595723063817 0.0 -0.023463595723063817
...
We can immediately notice that the major factor determining the probability of Hyperbilirubinemia=present is age. Of course in the real-world scenario, we would know the age of the patient before starting the diagnosis.
Our final diagnosis with a single pursued fault will switch to a cross-entropy measure for infoGain. We do not change observations and the pursued faults remain the same.
Python:
diag.set_single_fault_algorithm(pysmile.SingleFaultAlgorithmType.CROSSENTROPY)
Java:
diag.setSingleFaultAlgorithm(DiagNetwork.SingleFaultAlgorithmType.CROSSENTROPY);
C#:
diag.SingleFaultAlgorithm = DiagNetwork.SingleFaultAlgorithmType.Crossentropy;
R:
diag$setSingleFaultAlgorithm(diag$SingleFaultAlgorithmType$CROSSENTROPY)
The output from DiagNetwork.update now has non-negative infoGain for all observations. Note that fault probabilities do not change when the diagnostic measure algorithm is changed, therefore the fragment of the tutorial output below omits the fault info.
Observations:
Node Id Measure Cost InfoGain
age 0.05465458670852352 0.0 0.05465458670852352
hepatomegaly 0.01315927809591283 0.0 0.01315927809591283
ggtp 0.010610204503726073 0.0 0.010610204503726073
bilirubin 0.006204569424644146 0.0 0.006204569424644146
sex 0.0031695792371849163 0.0 0.0031695792371849163
pain_ruq 0.00263781234873367 0.0 0.00263781234873367
ESR 0.0026302997853497323 0.0 0.0026302997853497323
ama 0.0025319015011320833 0.0 0.0025319015011320833
hepatalgia 0.001572547559233084 0.0 0.001572547559233084
cholesterol 9.548883878895409E-4 0.0 9.548883878895409E-4
...
Without changing the observations, we now proceed to multi-fault diagnosis. We will keep Hyperbilirubinemia=present and add Steatosis=present. We know the fault index for the first fault already, but need to get the index for the second fault.
Python:
steatosis_idx = diag.get_fault_index("Steatosis", "present")
diag.set_pursued_faults([steatosis_idx, hyperbilirubinemia_idx])
Java:
int steatosisIdx = diag.getFaultIndex("Steatosis", "present");
diag.setPursuedFaults(new int[]{steatosisIdx, hyperbilirubinemiaIdx});
C#:
int steatosisIdx = diag.GetFaultIndex("Steatosis", "present");
diag.SetPursuedFaults(new int[] { steatosisIdx, hyperbilirubinemiaIdx });
R:
steatosisIdx <- diag$getFaultIndex("Steatosis", "present")
diag$setPursuedFaults(c(steatosisIdx, hyperbilirubinemiaIdx))
After a DiagNetwork.update we will get identical fault probabilities (because observations did not change), but the infoGains will be different:
Observations:
Node Id Measure Cost InfoGain
triglycerides 0.32730161296292315 0.0 0.32730161296292315
age 0.2455407606076575 0.0 0.2455407606076575
alcoholism 0.14812380191186358 0.0 0.14812380191186358
inr 0.13221077172053503 0.0 0.13221077172053503
irregular_liver 0.11230469436997036 0.0 0.11230469436997036
spleen 0.09007368131876663 0.0 0.09007368131876663
spiders 0.06621496955185409 0.0 0.06621496955185409
palms 0.06617286150395034 0.0 0.06617286150395034
edge 0.058990744385672464 0.0 0.058990744385672464
ast -0.056481838925186656 0.0 -0.056481838925186656
alt -0.05257654040287 0.0 -0.05257654040287
platelet 0.05126314745980294 0.0 0.05126314745980294
...
The default measure algorithm for multi-fault diagnosis uses the maximum magnitude of probability change over all faults and all observation outcomes. Our last diagnosis will keep the observations, but the measure algorithm will be normalized Euclidean distance in the fault probability vector space.
Python:
diag.set_multi_fault_algorithm(pysmile.MultiFaultAlgorithmType.L2_NORMALIZED_DISTANCE)
Java:
diag.setMultiFaultAlgorithm(DiagNetwork.MultiFaultAlgorithmType.L2_NORMALIZED_DISTANCE);
C#:
diag.MultiFaultAlgorithm = DiagNetwork.MultiFaultAlgorithmType.L2NormalizedDistance;
R:
diag$setMultiFaultAlgorithm(diag$MultiFaultAlgorithmType$L2_NORMALIZED_DISTANCE)
Here's the observation output after DiagNetwork.update:
Observations:
Node Id Measure Cost InfoGain
age 0.5131574568755791 0.0 0.5131574568755791
ast 0.36613951542960194 0.0 0.36613951542960194
alt 0.3263962662652687 0.0 0.3263962662652687
triglycerides 0.29763021106578275 0.0 0.29763021106578275
inr 0.23813502209247214 0.0 0.23813502209247214
alcoholism 0.23215767497663264 0.0 0.23215767497663264
bilirubin 0.2217351591088665 0.0 0.2217351591088665
hepatomegaly 0.21201689659082573 0.0 0.21201689659082573
ggtp 0.20797749804060328 0.0 0.20797749804060328
cholesterol 0.20654898750297776 0.0 0.20654898750297776
irregular_liver 0.20400352015821183 0.0 0.20400352015821183
ESR 0.19743075347810374 0.0 0.19743075347810374
spleen 0.18236843341781642 0.0 0.18236843341781642
albumin 0.18078914435171048 0.0 0.18078914435171048
...
This concludes tutorial 9.