DSL_sensitivity class contains an implementation of a sensitivity analysis algorithm proposed by Kjaerulff and van der Gaag (2000).
Given a set of target nodes, the algorithm calculates a complete set of derivatives of the posterior probability distributions over the target nodes over each numerical parameter of the Bayesian network. Note that these derivatives are dependent on the evidence currently set in the network and they give an indication of importance of precision of network numerical parameters for calculating the posterior probabilities of the targets. If the derivative is large for a parameter x, then a small change in x may lead to a large difference in the posteriors of the targets. If the derivative is small, then even a large change in the parameter will make little difference in the posteriors.
For each node, the sensitivity can be obtained as an actual value of the derivative, and also as a set of coefficients, which define the dependency between the target node posterior and the specific CPT parameter. The general form of the function is linear rational:
y = (Ax + B) / (Cx + D)
where y is the target posterior (calculated by inference algorithm) and x is the value of the specific CPT parameter. SMILE calculates the coefficients A, B, C, D and the derivative y' at the current value of x. The formula for the derivative is:
y' = (AD - BC) / (Cx + D)2
Because the denominator of the above equation is positive, the sign of the derivative is constant for all x, and hence the function is monotonic (or constant). By substituting 0 and 1 for x in the first formula (because x is a probability) we can calculate how much the posterior will change if x is modified in its CPT. The range is defined by:
y1 = B / D, y2 = (A + B) / (C+D)
The sign of AD-BC determines which of the two values is minimum and which is maximum.
As an illustration, let us use the HeparII.xdsl model, which is distributed with GeNIe and is also available from BayesFusion's online model repository at https://repo.bayesfusion.com/. The choice of the target node, evidence and CPT parameter is motivated only by the large value of the derivative:
x = P(bilirubin=a19_7 | Hyperbilirubinemia=absent, PBC=absent, Cirrhosis=absent, gallstones=absent, ChHepatitis=absent)
y = P(PBC=present | ast=149_40, irregular_liver=present, bilirubin=a19_7, proteins=a5_2)
Note that the right-hand side of the vertical bar in the definition of x determines the position of the parameter within the CPT of the bilirubin node, while the right-hand side of the vertical bar in the definition of y represents the evidence set in the network. The sensitivity output for x=0.02126152 (the current value of the parameter in the CPT) and y=0.82906518 (the calculated posterior probability) is:
y'=-3.96207, A=0, B=6.18863e-5, C=0.00035673, D=6.70612e-5
With known coefficients, we can now visualize the relationship between x and y:
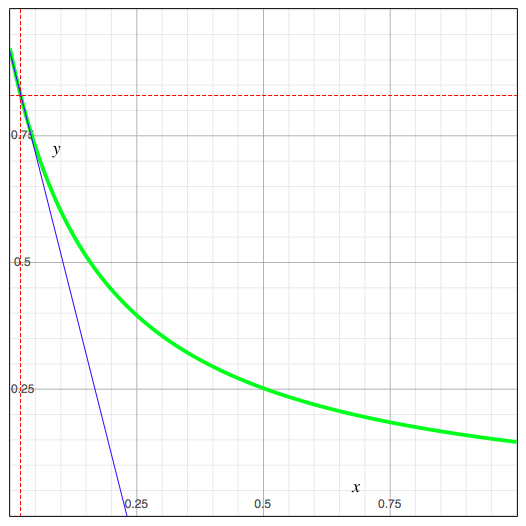
The green curve in the image represents the function y(x), the blue line represents the tangent of the green curve at the current value of x (its slope being equal to y') and the red dashed lines make it easier to locate the current (x,y) on the curve.
To perform sensitivity analysis, start with setting the target(s) in the network, instantiate the DSL_sensitivity object, and invoke its Calculate method. Next, read the values of derivatives and/or the function coefficients. The code snippet below uses the HeparII.xdsl network and calculates the sensitivity for the same CPT parameter and target node. To save space, it uses the SetEvidenceById helper function from Tutorial 2.
DSL_network net;
int res = net.ReadFile("HeparII.xdsl");
if (DSL_OKAY != res) return res;
SetEvidenceById(net, "ast", "a149_40");
SetEvidenceById(net, "irregular_liver", "present");
SetEvidenceById(net, "bilirubin", "a19_7");
SetEvidenceById(net, "proteins", "a5_2");
DSL_sensitivity sens;
res = sens.Calculate(net);
if (DSL_OKAY != res) return res;
int target = net.FindNode("PBC");
if (target < 0) return target;
DSL_sensitivity::Target targetNodeAndOutcome(target, 0);
int nodeUnderStudy = net.FindNode("bilirubin");
if (nodeUnderStudy < 0) return nodeUnderStudy;
// the CPT parameter index is specified as linear, but it is
// of course possible to obtain it by passing the outcomes
// of nodeUnderStudy and its parents to DSL_Dmatrix::CoordinatesToIndex
const int paramIndex = 285;
// just to ensure we have right paramIndex
const DSL_Dmatrix *cpt =
net.GetNode(nodeUnderStudy)->Def()->GetMatrix();
printf("x=%g\n", (*cpt)[paramIndex]);
const DSL_Dmatrix *yPrim =
sens.GetSensitivity(nodeUnderStudy, targetNodeAndOutcome);
double slope = (*yPrim)[paramIndex];
std::vector<const DSL_Dmatrix *> coeffs;
sens.GetCoefficients(nodeUnderStudy, targetNodeAndOutcome, coeffs);
printf("y'=%g\nA=%g B=%g C=%g D=%g\n", slope,
(*coeffs[0])[paramIndex], (*coeffs[1])[paramIndex],
(*coeffs[2])[paramIndex], (*coeffs[3])[paramIndex]);
The program outputs is:
x=0.0212615
y'=-3.96207
A=0 B=6.18863e-05 C=0.00035673 D=6.70612e-05
The DSL_sensitivity object owns the matrices containing the derivatives and the parameters - do not call delete on the pointers returned from its getter methods.
For performance reasons, the sensitivity algorithm works on a network processed by SMILE's relevance algorithms. Those nodes that do not affect target node's posteriors are dropped early by the relevance algorithms. The matrix objects returned for theses nodes by GetSensitivity and GetCoefficients will be empty (DSL_Dmatrix::GetSize will return zero). Unlike the example above, your code should include a check for the matrix size and assume that the target is not sensitive to changes in the node under study if the sensitivity matrix is empty.
Programs calculating sensitivity do not normally focus on a specific parameter. Instead, they iterate over the coefficients and derivatives over the entire CPT for one or more nodes. If your program only needs the maximum sensitivity value, use the overloaded DSL_sensitivity::GetMaxSensitivity methods. The returned numbers represent the maxima for the entire network, a single target node, a single node under study, or a combination of the two.
Sensitivity analysis can be performed on influence diagrams. In such case, the terminal utility node becomes the target for sensitivity calculations. The calculated coefficients depend on the outcomes for the utility indexing parents. Use the DSL_sensitivity::GetConfigCount and SetConfig to switch between different combinations of indexing parent outcomes.
See DSL_sensitivity reference for API details.