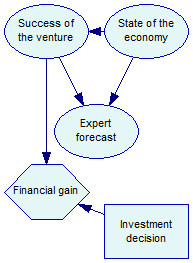
We will further expand the model created in Tutorial 1 and turn it into an influence diagram. To this effect, we will add a decision node Investment decision and a utility node Financial gain. The decision will have two possible states: Invest and DoNotInvest, which will be the two decision options under consideration. Which option is chosen will impact the financial gain and this will be reflected by a directed arc from Investment decision to Financial gain. Whether the venture succeeds of fails will also impact the financial gain and this will be also reflected by a directed arc from Success of the venture to Financial gain.
We will show how to create this model using SMILE and how to save it to disk. In the subsequent tutorial, we will show how to enter observations (evidence), how to perform inference, and how to retrieve the utilities calculated for the Financial gain node.
The programs starts by reading the file, just like Tutorial 2 and Tutorial 3. We convert the identfier of the node Success to node handle, which we will use later to create an arc between Success and Gain. Two new nodes will be created by calling a CreateNode helper function, which is a slightly modified version of the CreateCptNode from Tutorial 1. The difference is that we now want to create different types of nodes. Therefore, CreateNode has one additional input parameter, an integer for specifying the node type. Another difference is that CreateNode needs to be able to add utility nodes, which do not have outcomes. The function checks the number of outcome identifiers passed in, and the call to DSL_nodeDef::SetNumberOfOutcomes is skipped when there are none. We will need this check for our utility node, which has no outcomes.
Back in Tutorial4 function, we add nodes and arcs:
int i = CreateNode(net, DSL_LIST, "Invest", "Investment decision",
{ "Invest", "DoNotInvest" }, 160, 240);
int g = CreateNode(net, DSL_TABLE, "Gain", "Financial gain",
{}, 60, 200);
net.AddArc(i, g);
net.AddArc(s, g);
Note that DSL_LIST is the node type identifier for decision nodes. DSL_TABLE is the node type identifier for utility nodes. Decision nodes do not have numeric parameters, but utility nodes do. The structure of the matrix in utility node’s definition is similar to the CPT with the exception of the last dimension, which is always set to one (as there are no outcomes). Node Gain has two parents with two outcomes each and size of its definition is 2 x 2 x 1 = 4. The program specifies four numbers for the utilities.
res = net.GetNode(g)->Def()->SetDefinition({10000, -5000, 500, 500});
The influence diagram is now complete. We write its contents to file and exit the function. Tutorial 4 is now complete, Tutorial 5 will load the file and perform the inference.